【MMDetection3D】环境搭建,使用PointPillers训练&测试&可视化KITTI数据集
文章目录
- 前言
- 3D目标检测概述
- KITTI数据集简介
- MMDetection3D
-
- 环境搭建
- 数据集准备
- 训练
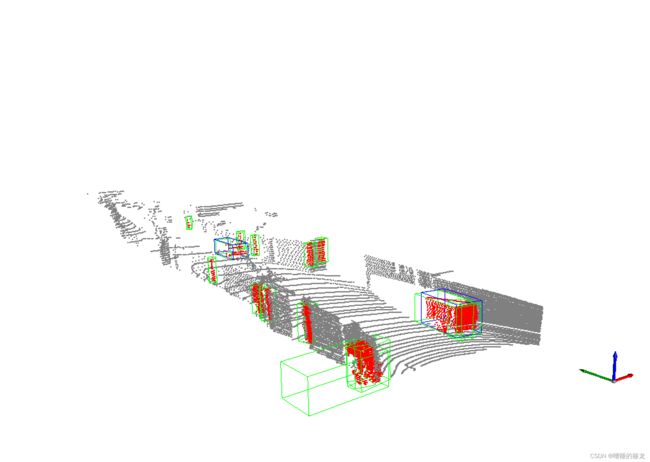
- 测试及可视化
- 绘制损失函数曲线
- 参考资料
前言
2D卷不动了,来卷3D,之后更多地工作会放到3D检测上
本文将简单介绍什么是3D目标检测、KITTI数据集以及MMDetection3D算法库,重点介绍如何在MMDetection3D中,使用PointPillars算法训练KITTI数据集,并对结果进行测试和可视化。
3D目标检测概述
对于一张输入图像,2D目标检测旨在给出物体类别并标出物体位置,而3D目标检测则要给出物体的位置(x, y, z)、尺寸(x_size, y_size, z_size)以及大致方向(框的朝向角),检测结果的示意图如下所示:

与2D目标检测相比,3D检测要处理更加多元的数据类型,得到更复杂的目标检测结果:
| 2D检测 | 3D检测 | |
|---|---|---|
| 输入数据 | 图片 | 点云(LiDAR)、图片(Camera)、多模态(点云+图片) |
| 输出结果 | 4-DoF(矩形框+分类) | 7-DoF(位置、尺寸、朝向角)、9-DoF(位置、尺寸、3个方向角) |
| 评估标准 | IOU、mAP | 3D-IoU-based or center-distance-based mAP |
KITTI数据集简介
KITTI官网:The KITTI Vision Benchmark Suite
相关论文1:Vision meets Robotics: The KITTI Dataset相关论文2:Are we ready for Autonomous Driving? The KITTI Vision Benchmark Suite
KITTI数据集由德国卡尔斯鲁厄理工学院和丰田美国技术研究院联合创办,是目前国际上最大的自动驾驶场景下的计算机视觉算法评测数据集。作者收集了长达6个小时的真实交通环境,数据集由经过校正和同步的图像、雷达扫描、高精度的GPS信息和IMU加速信息等多种模态的信息组成。该数据集用于评测立体图像(stereo),光流(optical flow),视觉测距(visual odometry),3D物体检测(object detection)和3D跟踪(tracking)等计算机视觉技术在车载环境下的性能。
场景:Road、City、Residential、Campus、Person
类别:Car、Van、Truck、Pedestrian、Person_sitting、Cyclist、Tram、Misc、DontCare,其中DontCare标签表示该区域没有被标注
3D目标检测数据集由7481个训练图像和7518个测试图像以及相应的点云数据组成,包括总共80256个标记对象。具体来看,下图蓝色框标记的为我们需要的数据,分别是
- 彩色图像数据(12GB)
- 点云数据(29GB)
- 相机矫正数据(16MB)
- 标签数据(5MB)
其中彩色图像数据、点云数据、相机矫正数据均包含training(7481)和testing(7518)两个部分,标签数据只有training部分。
MMDetection3D
MMDetection3D 是一个基于 PyTorch 的目标检测开源工具箱,面向3D检测的平台,是 OpenMMlab 项目的一部分(由香港中文大学多媒体实验室和商汤科技联合发起)。对MMDet3D的配置文件不熟悉的小伙伴可以移步至:教程 1: 学习配置文件,本文使用版本为: Release V1.1.0rc0,下面,让我们玩耍起来!!!
环境搭建
这里直接放上官网文档中的安装脚本,言简意赅,适合无脑follow~
# 在Anaconda中新建虚拟环境
conda create -n mmdet3d python=3.7 -y
conda activate mmdet3d

# 安装最新的PyTorch版本
conda install -c pytorch pytorch torchvision -y

# install mmcv
pip install mmcv-full

# install mmdetection
pip install git+https://github.com/open-mmlab/mmdetection.git

# install mmsegmentation
pip install git+https://github.com/open-mmlab/mmsegmentation.git

# install mmdetection3d
git clone https://github.com/open-mmlab/mmdetection3d.git
cd mmdetection3d
pip install -v -e . # or "python setup.py develop"
# -v:verbose, or more output
# -e:editable,修改本地文件,调用的模块以最新文件为准
数据集准备
直接参考官网提供的下载-预处理-训练-测试一条龙服务:3D 目标检测 KITTI 数据集
在官网下载 KITTI 3D 检测数据并解压缩所有 zip 文件,并将数据集根目录链接到 ./mmdetection3d/data/,在预处理数据之前,数据集结构组织方式如下:
mmdetection3d
├── mmdet3d
├── tools
├── configs
├── data
│   ├── kitti
│   │   ├── ImageSets
│   │   ├── testing
│   │   │   ├── calib
│   │   │   ├── image_2
│   │   │   ├── velodyne
│   │   ├── training
│   │   │   ├── calib
│   │   │   ├── image_2
│   │   │   ├── label_2
│   │   │   ├── velodyne
│   │   │   ├── planes (optional)
下面开始创建 KITTI 点云数据,首先需要加载原始的点云数据并生成相关的包含目标标签和标注框的数据标注文件,同时还需要为 KITTI 数据集生成每个单独的训练目标的点云数据,并将其存储在 data/kitti/kitti_gt_database 的 .bin 格式的文件中,此外,需要为训练数据或者验证数据生成 .pkl 格式的包含数据信息的文件。
通过运行下面的命令来创建最终的 KITTI 数据:
# 进入mmdetection3d主目录
cd mmdetection3d
# 创建文件夹
mkdir ./data/kitti/ && mkdir ./data/kitti/ImageSets

# Download data split
wget -c  https://raw.githubusercontent.com/traveller59/second.pytorch/master/second/data/ImageSets/test.txt --no-check-certificate --content-disposition -O ./data/kitti/ImageSets/test.txt
wget -c  https://raw.githubusercontent.com/traveller59/second.pytorch/master/second/data/ImageSets/train.txt --no-check-certificate --content-disposition -O ./data/kitti/ImageSets/train.txt
wget -c  https://raw.githubusercontent.com/traveller59/second.pytorch/master/second/data/ImageSets/val.txt --no-check-certificate --content-disposition -O ./data/kitti/ImageSets/val.txt
wget -c  https://raw.githubusercontent.com/traveller59/second.pytorch/master/second/data/ImageSets/trainval.txt --no-check-certificate --content-disposition -O ./data/kitti/ImageSets/trainval.txt

python tools/create_data.py kitti --root-path ./data/kitti --out-dir ./data/kitti --extra-tag kitti --with-plane
处理完成之后的目录如下:
kitti
├── ImageSets
│   ├── test.txt
│   ├── train.txt
│   ├── trainval.txt
│   ├── val.txt
├── testing
│   ├── calib
│   ├── image_2
│   ├── velodyne
│   ├── velodyne_reduced
├── training
│   ├── calib
│   ├── image_2
│   ├── label_2
│   ├── velodyne
│   ├── velodyne_reduced
│   ├── planes (optional)
├── kitti_gt_database
│   ├── xxxxx.bin
├── kitti_infos_train.pkl
├── kitti_infos_val.pkl
├── kitti_dbinfos_train.pkl
├── kitti_infos_test.pkl
├── kitti_infos_trainval.pkl
├── kitti_infos_train_mono3d.coco.json
├── kitti_infos_trainval_mono3d.coco.json
├── kitti_infos_test_mono3d.coco.json
├── kitti_infos_val_mono3d.coco.json
训练
数据集和环境都配置好后,就可以开始训练,使用命令python tools/train.py -h查看有哪些训练参数:
(mmdet3d) xxx@xxx:~/det3d/mmdetection3d$ python tools/train.py -h
usage: train.py [-h] [--work-dir WORK_DIR] [--resume-from RESUME_FROM]
                [--auto-resume] [--no-validate]
                [--gpus GPUS | --gpu-ids GPU_IDS [GPU_IDS ...] | --gpu-id
                GPU_ID] [--seed SEED] [--diff-seed] [--deterministic]
                [--options OPTIONS [OPTIONS ...]]
                [--cfg-options CFG_OPTIONS [CFG_OPTIONS ...]]
                [--launcher {none,pytorch,slurm,mpi}]
                [--local_rank LOCAL_RANK] [--autoscale-lr]
                config

Train a detector

positional arguments:
  config                train config file path

optional arguments:
  -h, --help            show this help message and exit
  --work-dir WORK_DIR   the dir to save logs and models
  --resume-from RESUME_FROM
                        the checkpoint file to resume from
  --auto-resume         resume from the latest checkpoint automatically
  --no-validate         whether not to evaluate the checkpoint during training
  --gpus GPUS           (Deprecated, please use --gpu-id) number of gpus to
                        use (only applicable to non-distributed training)
  --gpu-ids GPU_IDS [GPU_IDS ...]
                        (Deprecated, please use --gpu-id) ids of gpus to use
                        (only applicable to non-distributed training)
  --gpu-id GPU_ID       number of gpus to use (only applicable to non-
                        distributed training)
  --seed SEED           random seed
  --diff-seed           Whether or not set different seeds for different ranks
  --deterministic       whether to set deterministic options for CUDNN
                        backend.
  --options OPTIONS [OPTIONS ...]
                        override some settings in the used config, the key-
                        value pair in xxx=yyy format will be merged into
                        config file (deprecate), change to --cfg-options
                        instead.
  --cfg-options CFG_OPTIONS [CFG_OPTIONS ...]
                        override some settings in the used config, the key-
                        value pair in xxx=yyy format will be merged into
                        config file. If the value to be overwritten is a list,
                        it should be like key="[a,b]" or key=a,b It also
                        allows nested list/tuple values, e.g.
                        key="[(a,b),(c,d)]" Note that the quotation marks are
                        necessary and that no white space is allowed.
  --launcher {none,pytorch,slurm,mpi}
                        job launcher
  --local_rank LOCAL_RANK
  --autoscale-lr        automatically scale lr with the number of gpus
几个关键参数:
- configs:必选参数,训练模型的参数配置文件
- work-dir:可选参数,训练日志及权重文件保存文件夹,默认会新建
work-dirs文件夹,并保存在以configs文件名命名的文件夹中 - gpu-id:使用的GPU个数
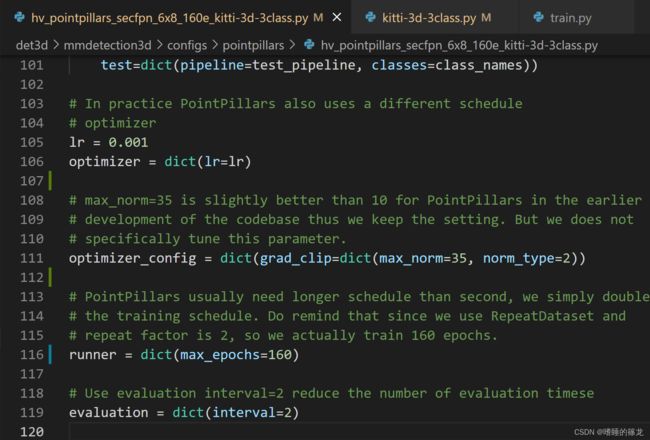
上述参数我们可以在命令行执行训练命令时,直接进行修改,但有些参数需要我们进入模型配置文件进行修改,这里以hv_pointpillars_secfpn_6x8_160e_kitti-3d-3class配置文件为例:
- 修改训练Epoch数:打开
/mmdetection3d/configs/pointpillars/hv_pointpillars_secfpn_6x8_160e_kitti-3d-3class.py文件,修改runner = dict(max_epochs=160)中的max_epochs参数

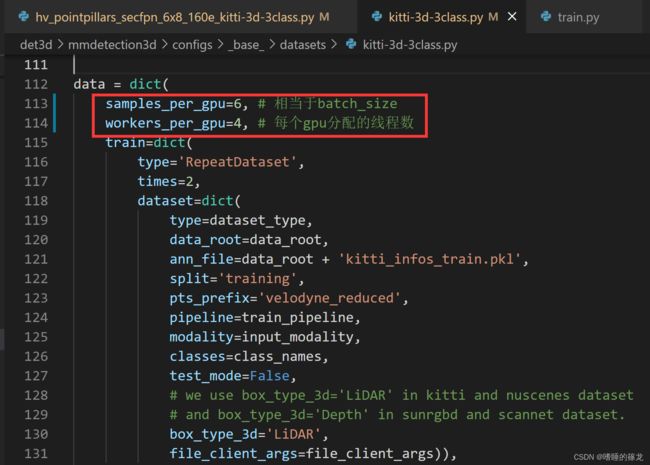
- 修改batch-size:打开
/mmdetection3d/configs/_base_/datasets/kitti-3d-3class.py文件,修改samples_per_gpu参数

设置好参数后,我们就可以直接执行命令进行训练了:
单GPU训练:
python tools/train.py configs/pointpillars/hv_pointpillars_secfpn_6x8_160e_kitti-3d-3class.py
多GPU训练:
CUDA_VISIBLE_DEVICES=0,1,2,3 tools/dist_train.sh configs/pointpillars/hv_pointpillars_secfpn_6x8_160e_kitti-3d-3class.py 4
训练结束后,我们可以在/mmdetection3d/work-dirs/hv_pointpillars_secfpn_6x8_160e_kitti-3d-3class文件夹中看到训练结果,包括日志文件(.log)、权重文件(.pth)以及模型配置文件(.py)等。
测试及可视化
首先使用命令查看测试函数有哪些可传入参数:python tools/test.py -h:
(mmdet3d) xxx@xxx:~/det3d/mmdetection3d$ python tools/test.py -h
usage: test.py [-h] [--out OUT] [--fuse-conv-bn]
               [--gpu-ids GPU_IDS [GPU_IDS ...]] [--gpu-id GPU_ID]
               [--format-only] [--eval EVAL [EVAL ...]] [--show]
               [--show-dir SHOW_DIR] [--gpu-collect] [--tmpdir TMPDIR]
               [--seed SEED] [--deterministic]
               [--cfg-options CFG_OPTIONS [CFG_OPTIONS ...]]
               [--options OPTIONS [OPTIONS ...]]
               [--eval-options EVAL_OPTIONS [EVAL_OPTIONS ...]]
               [--launcher {none,pytorch,slurm,mpi}] [--local_rank LOCAL_RANK]
               config checkpoint

MMDet test (and eval) a model

positional arguments:
  config                test config file path
  checkpoint            checkpoint file

optional arguments:
  -h, --help            show this help message and exit
  --out OUT             output result file in pickle format
  --fuse-conv-bn        Whether to fuse conv and bn, this will slightly
                        increasethe inference speed
  --gpu-ids GPU_IDS [GPU_IDS ...]
                        (Deprecated, please use --gpu-id) ids of gpus to use
                        (only applicable to non-distributed training)
  --gpu-id GPU_ID       id of gpu to use (only applicable to non-distributed
                        testing)
  --format-only         Format the output results without perform evaluation.
                        It isuseful when you want to format the result to a
                        specific format and submit it to the test server
  --eval EVAL [EVAL ...]
                        evaluation metrics, which depends on the dataset,
                        e.g., "bbox", "segm", "proposal" for COCO, and "mAP",
                        "recall" for PASCAL VOC
  --show                show results
  --show-dir SHOW_DIR   directory where results will be saved
  --gpu-collect         whether to use gpu to collect results.
  --tmpdir TMPDIR       tmp directory used for collecting results from
                        multiple workers, available when gpu-collect is not
                        specified
  --seed SEED           random seed
  --deterministic       whether to set deterministic options for CUDNN
                        backend.
  --cfg-options CFG_OPTIONS [CFG_OPTIONS ...]
                        override some settings in the used config, the key-
                        value pair in xxx=yyy format will be merged into
                        config file. If the value to be overwritten is a list,
                        it should be like key="[a,b]" or key=a,b It also
                        allows nested list/tuple values, e.g.
                        key="[(a,b),(c,d)]" Note that the quotation marks are
                        necessary and that no white space is allowed.
  --options OPTIONS [OPTIONS ...]
                        custom options for evaluation, the key-value pair in
                        xxx=yyy format will be kwargs for dataset.evaluate()
                        function (deprecate), change to --eval-options
                        instead.
  --eval-options EVAL_OPTIONS [EVAL_OPTIONS ...]
                        custom options for evaluation, the key-value pair in
                        xxx=yyy format will be kwargs for dataset.evaluate()
                        function
  --launcher {none,pytorch,slurm,mpi}
                        job launcher
  --local_rank LOCAL_RANK
可以看到有两个必选参数config和checkpoint,分别为模型配置文件和训练生成的权重文件,其他参数:
- eval:使用的评价指标,取决于数据集(“bbox”, “segm”, “proposal” for COCO, and “mAP”, “recall” for PASCAL VOC),这里直接沿用了2D检测中常用的几个评价标准
- show:是否对测试结果进行可视化,要安装open3d库(没有的话,直接
pip install open3d即可) - out_dir:测试结果的保存目录
指定好参数后,直接执行命令进行测试:
(mmdet3d) xxx@xxx:~/det3d/mmdetection3d$ python tools/test.py configs/pointpillars/hv_pointpillars_secfpn_6x8_160e_kitti-3d-3class.py work_dirs/hv_pointpillars_secfpn_6x8_160e_kitti-3d-3class/latest.pth --eval mAP --options 'show=True' 'out_dir=./outputs/pointpillars_kitti_160e/show_results'
tools/test.py:125: UserWarning: --options is deprecated in favor of --eval-options
  warnings.warn('--options is deprecated in favor of --eval-options')
[>>>>>>>>>>>>>>>>>>>>>>>>>>>>>>>>>>>>>>>>>>>>>>>>>>] 3769/3769, 29.0 task/s, elapsed: 130s, ETA:     0s
Converting prediction to KITTI format
[>>>>>>>>>>>>>>>>>>>>>>>>>>>>>>>>>>>>>>>>>>>>>>>>>>] 3769/3769, 810.7 task/s, elapsed: 5s, ETA:     0s
Result is saved to /tmp/tmpy6dxos64/results.pkl.
OMP: Info #276: omp_set_nested routine deprecated, please use omp_set_max_active_levels instead.


----------- AP11 Results ------------

Pedestrian [email protected], 0.50, 0.50:
bbox AP11:66.2971, 63.2572, 60.1334
bev  AP11:59.5338, 53.1795, 49.7129
3d   AP11:52.5578, 46.1416, 42.2523
aos  AP11:43.38, 45.16, 42.93
Pedestrian [email protected], 0.25, 0.25:
bbox AP11:66.2971, 63.2572, 60.1334
bev  AP11:75.2633, 71.2403, 67.1669
3d   AP11:74.8591, 70.7085, 66.6911
aos  AP11:43.38, 45.16, 42.93
Cyclist [email protected], 0.50, 0.50:
bbox AP11:86.2886, 71.9338, 69.5510
bev  AP11:83.8300, 66.6311, 62.5886
3d   AP11:78.8692, 60.6178, 57.6603
aos  AP11:84.20, 67.30, 64.90
Cyclist [email protected], 0.25, 0.25:
bbox AP11:86.2886, 71.9338, 69.5510
bev  AP11:87.6232, 70.1303, 67.9132
3d   AP11:87.6232, 70.1303, 67.9132
aos  AP11:84.20, 67.30, 64.90
Car [email protected], 0.70, 0.70:
bbox AP11:90.5724, 89.2393, 86.4065
bev  AP11:89.0184, 85.9051, 79.4069
3d   AP11:82.8837, 75.8976, 68.6418
aos  AP11:90.32, 88.57, 85.49
Car [email protected], 0.50, 0.50:
bbox AP11:90.5724, 89.2393, 86.4065
bev  AP11:90.6432, 89.8263, 88.9269
3d   AP11:90.6432, 89.7432, 88.6185
aos  AP11:90.32, 88.57, 85.49

Overall AP11@easy, moderate, hard:
bbox AP11:81.0527, 74.8101, 72.0303
bev  AP11:77.4607, 68.5719, 63.9028
3d   AP11:71.4369, 60.8857, 56.1848
aos  AP11:72.63, 67.01, 64.44

----------- AP40 Results ------------

Pedestrian [email protected], 0.50, 0.50:
bbox AP40:66.8732, 63.0849, 59.3729
bev  AP40:58.9596, 52.1341, 47.7997
3d   AP40:51.0936, 44.6986, 40.1848
aos  AP40:44.17, 42.06, 39.35
Pedestrian [email protected], 0.25, 0.25:
bbox AP40:66.8732, 63.0849, 59.3729
bev  AP40:75.9021, 72.3613, 68.1043
3d   AP40:75.5368, 71.7994, 67.5858
aos  AP40:44.17, 42.06, 39.35
Cyclist [email protected], 0.50, 0.50:
bbox AP40:90.1101, 73.4135, 70.3551
bev  AP40:86.8236, 66.8870, 62.6626
3d   AP40:79.8955, 60.5005, 56.6893
aos  AP40:87.75, 68.17, 65.11
Cyclist [email protected], 0.25, 0.25:
bbox AP40:90.1101, 73.4135, 70.3551
bev  AP40:89.9274, 71.4334, 68.2619
3d   AP40:89.9274, 71.4334, 68.2619
aos  AP40:87.75, 68.17, 65.11
Car [email protected], 0.70, 0.70:
bbox AP40:95.4900, 91.9898, 87.3376
bev  AP40:91.5044, 87.7621, 83.4334
3d   AP40:84.6332, 75.8790, 71.2976
aos  AP40:95.19, 91.24, 86.38
Car [email protected], 0.50, 0.50:
bbox AP40:95.4900, 91.9898, 87.3376
bev  AP40:95.6766, 94.7296, 90.1260
3d   AP40:95.6384, 94.3234, 89.9369
aos  AP40:95.19, 91.24, 86.38

Overall AP40@easy, moderate, hard:
bbox AP40:84.1578, 76.1627, 72.3552
bev  AP40:79.0958, 68.9277, 64.6319
3d   AP40:71.8741, 60.3594, 56.0572
aos  AP40:75.70, 67.16, 63.61
注意!!! 如果在VScode的终端执行测试命令,在可视化的地方会出现以下警告:
[Open3D WARNING] GLFW Error: X11: The DISPLAY environment variable is missing
[Open3D WARNING] Failed to initialize GLFW
这是因为当前窗口DISPLAY环境变量为空,无法使用GLFW(创建OpenGL上下文,以及操作窗口的第三方库)
解决办法:
首先在MobaXterm中输入:echo $DISPLAY,查看当前窗口DISPLAY环境变量的值
(mmdet3d) xxx@xxx:~/det3d/mmdetection3d$ echo $DISPLAY
localhost:10.0
之后,在VScode的终端输设置DISPLAY环境变量的值为10.0,并查看:
(mmdet3d) xxx@xxx:~/det3d/mmdetection3d$ export DISPLAY=:10.0
(mmdet3d) xxx@xxx:~/det3d/mmdetection3d$ echo $DISPLAY
:10.0
再次运行测试命令,可视化正常!!!!
绘制损失函数曲线
MMDet3D中,提供了tools/analysis_tools/analyze_logs.py文件,用于绘制训练过程中的损失函数曲线和计算平均训练时间(目前仅支持这俩功能),执行python tools/analysis_tools/analyze_logs.py -h命令,查看函数参数:
(mmdet3d) xxx@xxx:~/det3d/mmdetection3d$ python tools/analysis_tools/analyze_logs.py -h
usage: analyze_logs.py [-h] {plot_curve,cal_train_time} ...
Analyze Json Log

positional arguments:
  {plot_curve,cal_train_time}
                        task parser
    plot_curve          parser for plotting curves
    cal_train_time      parser for computing the average time per training
                        iteration

optional arguments:
  -h, --help            show this help message and exit
可以看到有两个必选参数:plot_curve, cal_train_time,二者选其一即可,这里以plot_curve为例,绘制损失函数曲线图,执行如下命令:
(mmdet3d) xxx@xxx:~/det3d/mmdetection3d$ python tools/analysis_tools/analyze_logs.py plot_curve work_dirs/hv_pointpillars_secfpn_6x8_160e_kitti-3d-3class/20221002_160858.log.json --keys loss_cls loss_bbox --out losses.pdf
plot curve of work_dirs/hv_pointpillars_secfpn_6x8_160e_kitti-3d-3class/20221002_160858.log.json, metric is loss_cls
plot curve of work_dirs/hv_pointpillars_secfpn_6x8_160e_kitti-3d-3class/20221002_160858.log.json, metric is loss_bbox
save curve to: losses.pdf
命令执行结束,会在/mmdetection3d目录下生成losses.pdf文件,绘制曲线如下所示:

注意!! 原本生成的曲线图并不是这样子,我自己根据个人喜好修改了analyze_logs.py中绘图部分的代码,感兴趣的小伙伴可以参考一下(直接复制粘贴即可):
# Copyright (c) OpenMMLab. All rights reserved.
import argparse
import json
from collections import defaultdict

import numpy as np
import seaborn as sns
from matplotlib import pyplot as plt

# 定义plt字体大小
plt.rcParams.update({'font.size': 8})

def cal_train_time(log_dicts, args):
    for i, log_dict in enumerate(log_dicts):
        print(f'{"-" * 5}Analyze train time of {args.json_logs[i]}{"-" * 5}')
        all_times = []
        for epoch in log_dict.keys():
            if args.include_outliers:
                all_times.append(log_dict[epoch]['time'])
            else:
                all_times.append(log_dict[epoch]['time'][1:])
        all_times = np.array(all_times)
        epoch_ave_time = all_times.mean(-1)
        slowest_epoch = epoch_ave_time.argmax()
        fastest_epoch = epoch_ave_time.argmin()
        std_over_epoch = epoch_ave_time.std()
        print(f'slowest epoch {slowest_epoch + 1}, '
              f'average time is {epoch_ave_time[slowest_epoch]:.4f}')
        print(f'fastest epoch {fastest_epoch + 1}, '
              f'average time is {epoch_ave_time[fastest_epoch]:.4f}')
        print(f'time std over epochs is {std_over_epoch:.4f}')
        print(f'average iter time: {np.mean(all_times):.4f} s/iter')
        print()


def plot_curve(log_dicts, args):
    if args.backend is not None:
        plt.switch_backend(args.backend)
    sns.set_style(args.style)

    # 设置图片标题
    if args.title is None:
        title = args.json_logs[0]

    # 设置图标
    # if legend is None, use {filename}_{key} as legend
    legend = args.legend
    if legend is None:
        legend = []
        for json_log in args.json_logs:
            for metric in args.keys:
                # legend.append(f'{json_log}_{metric}')
                legend.append(f'{metric}')
    assert len(legend) == (len(args.json_logs) * len(args.keys))
    metrics = args.keys

    num_metrics = len(metrics)
    for i, log_dict in enumerate(log_dicts):
        epochs = list(log_dict.keys())
        for j, metric in enumerate(metrics):
            print(f'plot curve of {args.json_logs[i]}, metric is {metric}')
            if metric not in log_dict[epochs[args.interval - 1]]:
                raise KeyError(
                    f'{args.json_logs[i]} does not contain metric {metric}')

            if args.mode == 'eval':
                if min(epochs) == args.interval:
                    x0 = args.interval
                else:
                    # if current training is resumed from previous checkpoint
                    # we lost information in early epochs
                    # `xs` should start according to `min(epochs)`
                    if min(epochs) % args.interval == 0:
                        x0 = min(epochs)
                    else:
                        # find the first epoch that do eval
                        x0 = min(epochs) + args.interval - \
                            min(epochs) % args.interval
                xs = np.arange(x0, max(epochs) + 1, args.interval)
                ys = []
                for epoch in epochs[args.interval - 1::args.interval]:
                    ys += log_dict[epoch][metric]

                # if training is aborted before eval of the last epoch
                # `xs` and `ys` will have different length and cause an error
                # check if `ys[-1]` is empty here
                if not log_dict[epoch][metric]:
                    xs = xs[:-1]

                ax = plt.gca()
                ax.set_xticks(xs)
                plt.xlabel('epoch')
                plt.plot(xs, ys, label=legend[i * num_metrics + j], marker='o')
            else:
                xs = []
                ys = []
                num_iters_per_epoch = \
                    log_dict[epochs[args.interval-1]]['iter'][-1]
                for epoch in epochs[args.interval - 1::args.interval]:
                    iters = log_dict[epoch]['iter']
                    if log_dict[epoch]['mode'][-1] == 'val':
                        iters = iters[:-1]
                    xs.append(
                        np.array(iters) + (epoch - 1) * num_iters_per_epoch)
                    ys.append(np.array(log_dict[epoch][metric][:len(iters)]))
                xs = np.concatenate(xs)
                ys = np.concatenate(ys)
                plt.xlabel('iter')
                plt.plot(
                    xs, ys, label=legend[i * num_metrics + j], linewidth=0.5)
            plt.legend()
        plt.title(title)
    if args.out is None:
        plt.show()
    else:
        print(f'save curve to: {args.out}')
        plt.savefig(args.out)
        plt.cla()


def add_plot_parser(subparsers):
    parser_plt = subparsers.add_parser(
        'plot_curve', help='parser for plotting curves')
    parser_plt.add_argument(
        'json_logs',
        type=str,
        nargs='+',
        help='path of train log in json format')
    parser_plt.add_argument(
        '--keys',
        type=str,
        nargs='+',
        default=['mAP_0.25'],
        help='the metric that you want to plot')
    parser_plt.add_argument('--title', type=str, help='title of figure')
    parser_plt.add_argument(
        '--legend',
        type=str,
        nargs='+',
        default=None,
        help='legend of each plot')
    parser_plt.add_argument(
        '--backend', type=str, default=None, help='backend of plt')
    parser_plt.add_argument(
        '--style', type=str, default='dark', help='style of plt')
    parser_plt.add_argument('--out', type=str, default=None)
    parser_plt.add_argument('--mode', type=str, default='train')
    parser_plt.add_argument('--interval', type=int, default=1)


def add_time_parser(subparsers):
    parser_time = subparsers.add_parser(
        'cal_train_time',
        help='parser for computing the average time per training iteration')
    parser_time.add_argument(
        'json_logs',
        type=str,
        nargs='+',
        help='path of train log in json format')
    parser_time.add_argument(
        '--include-outliers',
        action='store_true',
        help='include the first value of every epoch when computing '
        'the average time')


def parse_args():
    parser = argparse.ArgumentParser(description='Analyze Json Log')
    # currently only support plot curve and calculate average train time
    # 目前仅支持绘制曲线和计算平均训练时间
    subparsers = parser.add_subparsers(dest='task', help='task parser')
    add_plot_parser(subparsers)
    add_time_parser(subparsers)
    args = parser.parse_args()
    return args


def load_json_logs(json_logs):
    # load and convert json_logs to log_dict, key is epoch, value is a sub dict
    # keys of sub dict is different metrics, e.g. memory, bbox_mAP
    # value of sub dict is a list of corresponding values of all iterations
    log_dicts = [dict() for _ in json_logs]
    for json_log, log_dict in zip(json_logs, log_dicts):
        with open(json_log, 'r') as log_file:
            for line in log_file:
                log = json.loads(line.strip())
                # skip lines without `epoch` field
                if 'epoch' not in log:
                    continue
                epoch = log.pop('epoch')
                if epoch not in log_dict:
                    log_dict[epoch] = defaultdict(list)
                for k, v in log.items():
                    log_dict[epoch][k].append(v)
    return log_dicts


def main():
    args = parse_args()

    json_logs = args.json_logs
    for json_log in json_logs:
        assert json_log.endswith('.json')

    log_dicts = load_json_logs(json_logs)

    eval(args.task)(log_dicts, args)


if __name__ == '__main__':
    main()
参考资料
KITTI数据集下载及解析
【深度估计】KITTI数据集介绍与使用说明
MMDETECTION3D’S DOCUMENTATION
MMdetection3d环境搭建、使用MMdetection3d做3D目标检测训练自己的数据集、测试、可视化,以及常见的错误
社区开放麦#8 | 迈向真实世界的感知:3D 目标检测
