【如何R实现聚类算法及3D可视化展示】:kmeans聚类方法在用户价值细分上的应用
Author : QQ Zhou
大家应该很熟悉RFM模型,这是在做用户价值细分常用的方法。主要涵盖的指标有R(Recency);消费频率(Frequency);消费金额(Monetary);RFM模型在用户价值细分上具有很强的解释性和可操作性。但以下为了展示R是如何聚类算法及可视化。我们姑且用R、F、M三个指标聚类得出具有实用性和解释性的结论。
数据见文章最后。
步骤一:读入数据,查看数据。
#在此,我将原始数据存放在桌面,命名为customer_data.csv
#读入数据
customer_data=read.csv("C:\\Users\\Administrator\\Desktop\\customer_data.csv",header=TRUE)
#更改名称
names(customer_data)<-c("cust_id","total_amt","cnt","datetime")
#cust_id为用户id,total_amt是用户在指定时间内的总消费金额,cnt是用户在制定时间内的总消费次数,datetime为用户最近一次购买商品的时间
#查看数据
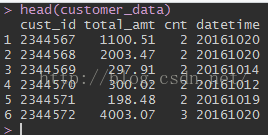
head(customer_data)
步骤二:数据处理
- 原始数据做变换,比如在此我们需要将最近一次访问时间(datetime)处理成最近一次访问时间到当前的时间间隔,即代表用户目前是否活跃
- 去变量之间的相关性(线性变换、主成分分析等)
- 去异常值
#原始数据变换
#将最近一次访问时间处理成最近一次访问时间到当前的时间间隔,代表该用户是否最近有购买记录(即目前是否活跃)
customer_data$datetime<-as.character.Date(customer_data$datetime)
customer_data$tm_intrvl=as.numeric(max(as.Date(customer_data$datetime,format="%Y%m%d"))-as.Date(customer_data$datetime,format="%Y%m%d"))+1
#去变量之间的相关性(在此做线性变换)
#先检查是否有相关性
cor(customer_data[,c("total_amt","cnt","tm_intrvl")])
#除去变量的相关性
customer_data$avg_amt<-round(customer_data$total_amt/customer_data$cnt,2)
#查看结果,变量之间相关系数较小,可以认为变量间无明显相关关系
cor(customer_data[,c("avg_amt","cnt","tm_intrvl")])
结果:
#去异常值
#因为kmeans受异常值影响很大,所以先要剔除这些异常值或对异常值先定义类别
summary(customer_data[,c("avg_amt","cnt","tm_intrvl")])
Q1=quantile(customer_data$avg_amt,0.99)
data=customer_data[customer_data$avg_amt<=Q1,]
plot(customer_data$avg_amt)
plot(customer_data$cnt)
plot(customer_data$tm_intrvl)

#由于上述平均金额变异比较大,所以先去除了该变量的异常值,然后再做聚类。在此去除异常并非这个用户异常,而是改善聚类结果。最后需要给这些“异常用户”做业务解释。
如超重要级用户等。
#归一化处理 (最大值最小值化、正态标准化)
scale=function(x){
  max=max(x)
  min=min(x)
  scale=(x-min)/(max-min)
  return(scale)
}
scale_reverse=function(x){
  max=max(x)
  min=min(x)
  scale_reverse=(max-x)/(max-min)
  return(scale_reverse)
}

#kmeans
scale_data=data.frame(sapply(customer_data[customer_data$avg_amt<=Q1,][,c("avg_amt","cnt")],scale),
tm_intrvl=scale_reverse(customer_data[customer_data$avg_amt<=Q1,][,c("tm_intrvl")]))
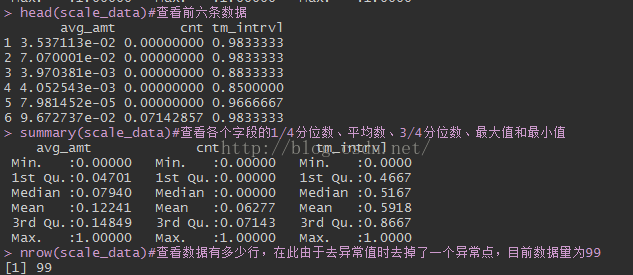
head(scale_data)#查看前六条数据
summary(scale_data)#查看各个字段的1/4分位数、平均数、3/4分位数、最大值和最小值
nrow(scale_data)#查看数据有多少行,在此由于去异常值时去掉了一个异常点,目前数据量为99
步骤三:完成上述处理,我们就可以开始kmeans聚类了。
#kmeans聚类
set.seed(1234)
ks=kmeans(scale_data,3,iter.max=50)
result=data.frame(customer_data[customer_data$avg_amt<=Q1,][,c("cust_id","avg_amt","cnt","tm_intrvl")],cluster=ks$cluster)
#查看聚类结果
prop.table(table(ks$cluster))
#查看类中心
#install.packages(dplyr)
library(dplyr)
data.frame(result%>%group_by(cluster)%>%summarise(avg_amt=mean(avg_amt),avg_cnt=mean(cnt),avg_intrvl=mean(tm_intrvl)))
聚类结果如下:
步骤四:聚类结果3D可视化展示
#在此
#install.packages("scatterD3")
#library(scatterD3)
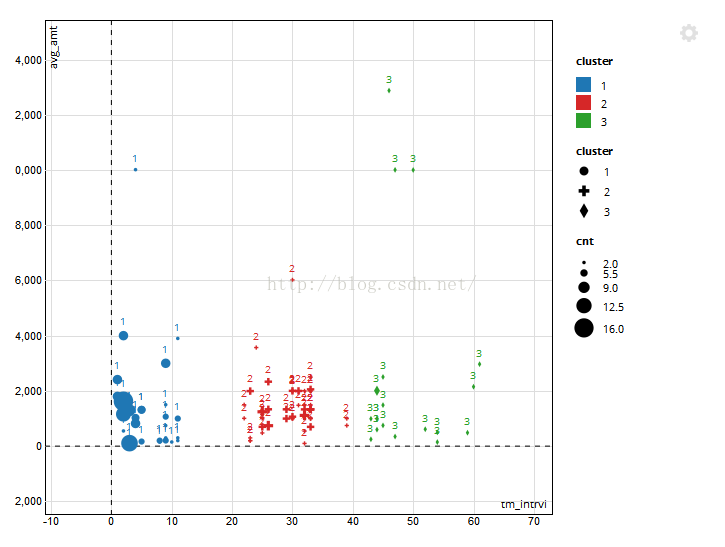
scatterD3(data=result,x=tm_intrvl,y=avg_amt,lab=cluster,col_var=cluster,symbol_var=cluster,size_var= cnt)
#x轴为最近一次访问时间间隔,y轴为平均消费金额,形状大小代表用户访问频率高低。不同颜色代表不同类别。
步骤四:解释
| 类别 | 占比 | 描述 |
| 第一类:高价值用户 | 32.3% | 购买频率高(平均4次);消费金额较高(平均1400元);最近一周有过购买行为,这部分用户需要大力发展。 |
| 第二类:中价值用户 | 48.5% | 购买频率中等(平均2.4次);消费金额较高(平均1400);最近一个月有个购买行为,这部分用户可以适当诱导购买。 |
| 第三类:高价值挽留用户 | 19.2% | 购买频率高(平均2次);消费金额较高(平均2667元);较长时间没有购买行为,这部分客户需要尽量挽留 |
附录:数据
cust_id	fnd_rdm_amt_thr_mnth	fnd_rdm_cnt_thr_mnth	fnd_lst_trd_dt
2344567	1100.51	2	20161020
2344568	2003.47	2	20161020
2344569	297.91	2	20161014
2344570	300.02	2	20161012
2344571	198.48	2	20161019
2344572	4003.07	3	20161020
2344573	4003.07	3	20161020
2344574	393.39	2	20160929
2344575	611.3	3	20161013
2344576	597.73	2	20161013
2344577	399.32	2	20160929
2344578	20026.55	2	20161018
2344579	1997.57	2	20160922
2344580	3202.77	3	20161013
2344581	597.72	2	20160929
2344582	600.04	3	20161014
2344583	3995.11	2	20160922
2344584	3995.11	2	20160922
2344585	3984.27	2	20160922
2344586	7003.05	3	20160926
2344587	2001.23	2	20160927
2344588	2001.23	2	20160919
2344589	2094.91	3	20160919
2344590	2964.5	4	20160926
2344591	1982.58	2	20160909
2344592	3000.62	2	20160920
2344593	4000	2	20160922
2344594	5003.06	2	20160919
2344595	2098.71	3	20160927
2344596	196.44	2	20160920
2344597	401.46	2	20161011
2344598	20007.34	5	20161020
2344599	2001.23	2	20160922
2344600	2961.03	2	20160921
2344601	3997.09	2	20160920
2344602	1491.21	2	20161013
2344603	4105.47	5	20161018
2344604	1998.17	2	20160913
2344605	497.28	2	20160909
2344606	2306.61	2	20160927
2344607	9006.76	5	20161021
2344608	5982.51	3	20160929
2344609	2199.46	2	20161020
2344610	1088.6	2	20160920
2344611	3991.01	3	20160920
2344612	2000.01	2	20160908
2344613	501.79	3	20161017
2344614	15002.45	5	20161013
2344615	601.1	2	20161011
2344616	2986.69	2	20160919
2344617	2012.68	2	20160930
2344618	1500.5	2	20160907
2344619	3988.51	3	20160919
2344620	20010.44	2	20160905
2344621	20002.57	2	20160902
2344622	5266.72	4	20161017
2344623	5266.72	4	20161017
2344624	7801.58	2	20161011
2344625	294.18	2	20160829
2344626	972.54	2	20160824
2344627	1978.62	2	20160908
2344628	694.73	2	20160905
2344629	1196.04	2	20160908
2344630	4451.68	4	20160920
2344631	2010.49	2	20160919
2344632	2994.46	2	20160930
2344633	1000.37	2	20160829
2344634	3199.49	3	20160922
2344635	6023.75	3	20160908
2344636	1296.24	12	20161019
2344637	4003.67	3	20160926
2344638	4001.54	2	20160919
2344639	4000.61	3	20160923
2344640	4001.83	3	20160919
2344641	5999.42	3	20160921
2344642	4975.83	4	20160927
2344643	12052.96	5	20161021
2344644	5010.82	2	20160907
2344645	3001.22	2	20161013
2344646	2992.68	3	20160923
2344647	4002.45	2	20160919
2344648	5938.52	2	20160822
2344649	4001.83	3	20160919
2344650	7141.16	2	20160928
2344651	26010.8	16	20161020
2344652	9102.11	7	20161019
2344653	1225.07	2	20160831
2344654	6168.28	3	20160919
2344655	2997.94	3	20161011
2344656	2972.38	2	20160907
2344657	4303.51	2	20160823
2344658	4100.16	4	20161018
2344659	2001.23	2	20160919
2344660	11594.24	10	20161020
2344661	12039.49	2	20160922
2344662	1494.97	2	20160913
2344663	954.77	2	20160927
2344664	6006.78	3	20160922
2344665	25755.7	2	20160906
2344666	60201.48	2	20161011


