【人工智能】感知器算法的设计实现(QDU)
- 【人工智能】Astar算法求解8数码问题(QDU)
- 【人工智能】利用α-β搜索的博弈树算法编写一字棋游戏(QDU)
- 【人工智能】Fisher 线性分类器的设计与实现(QDU)
- 【人工智能】感知器算法的设计实现(QDU)
- 【人工智能】SVM 分类器的设计与应用(QDU)
- 卷积神经网络 CNN 框架的实现与应用(写的比较水,就没放上)
实验目的
- 熟悉感知器算法。
- 掌握感知准则函数分类器设计方法。
- 掌握感知器算法,利用它对输入的数据进行多类分类。
实验原理
感知器算法
基本思想
对于线性判别函数,当模式的维数已知时,判别函数的形式实际上就已经确定下来,线性判别的过程即是确定权向量。感知器是一种神经网络模型,其特点是随意确定判别函数初始值,在对样本分类训练过程中,针对分类错误的样本不断进行权值修正,逐步迭代直至最终分类符合预定标准,从而确定权向量值。可以证明感知器是一种收敛算法,只要模式类别是线性可分的,就可以在有限的迭代步数里求出权向量的解。
判别函数
设样本 d d d维特征空间中描述,则两类别问题中线性决策面的一般形式可表示成: g ( X ) = W T X + w 0 g(X) = W^TX+w_0 g(X)=WTX+w0
将线性判别函数齐次化为: g ( X ) = W T X + w 0 = α T y g(X) = W^TX+w_0=\alpha^Ty g(X)=WTX+w0=αTy
其中, y = [ x 1 ] y=\left[\begin{matrix} x \\ 1 \end{matrix}\right] y=[x1]称为增广样本向量, α = [ w w 0 ] \alpha=\left[\begin{matrix} w \\ w_0 \end{matrix}\right] α=[ww0]称为增广权向量。
线性判别函数的齐次简化使特征空间增加了一维,但保持了样本间的欧氏距离不变, 对于分类效果也与原决策面相同,只是在Y空间中决策面是通过坐标原点的。
判别规则(与Fisher中类似):
g ( X ) = α T y { i f g ( X ) > 0 , t h e n X ∈ c l a s s 1 i f g ( X ) < 0 , t h e n X ∈ c l a s s 2 i f g ( X ) = 0 , t h e n X ∈ c l a s s 1 o r c l a s s 2 g(X) = \alpha^Ty\space\space\space\space \left\{\begin{array}{l} if \space\space\space\space g(X)>0, \space\space\space\space then \space\space\space\space X∈class_1 \\ if \space\space\space\space g(X)<0, \space\space\space\space then \space\space\space\space X∈class_2 \\ if \space\space\space\space g(X)=0, \space\space\space\space then \space\space\space\space X∈class_1 \space or \space class_2\end{array}\right. g(X)=αTy ⎩⎨⎧if g(X)>0, then X∈class1if g(X)<0, then X∈class2if g(X)=0, then X∈class1 or class2
反过来说,如果存在一个权向量 α \alpha α,使得对于任何 y ∈ c l a s s 1 y∈class_1 y∈class1都有 α T > 0 \alpha^T>0 αT>0, 而对任何 y < c l a s s 2 y
y<class2 ,都有 α T y < 0 \alpha^Ty<0 αTy<0, 则称这组样本集为线性可分的,否则称样本集为线性不可分的。
准则函数
样本的规范化
根据线性可分的定义,如果样本集 y 1 , y 2 , . . . , y N y_1,y_2,...,y_N y1,y2,...,yN是线性可分的,则必存在某个或某些权向量 α \alpha α,使得
g ( X ) = α T y { > 0 , 对 于 一 切 X ∈ c l a s s 1 < 0 , 对 于 一 切 X ∈ c l a s s 2 g(X) = \alpha^Ty\space\space\space\space \begin{cases}>0, \space\space\space\space 对于一切X∈class_1 \\ <0, \space\space\space\space 对于一切X∈class_2 \\ \end{cases} g(X)=αTy {>0, 对于一切X∈class1<0, 对于一切X∈class2
如果将第二类样本都取其反向向量,则有:
y ′ = { y , i f y ∈ c l a s s 1 − y , i f y ∈ c l a s s 2 y' = \left\{\begin{array}{l} \space\space\space y, \space\space\space\space if \space\space\space\space y∈class_1 \\ -y, \space\space\space\space if \space\space\space\space y∈class_2 \\ \end{array}\right. y′={ y, if y∈class1−y, if y∈class2
也就是说不管样本原来的类别标识,只要找到一个对全部样本都满足 α T y i ′ > 0 , i = 1 , 2 , . . , N \alpha^Ty'_i>0,\space\space i=1,2,..,N αTyi′>0, i=1,2,..,N的权向量 α \alpha α即可。
注:为了方便,下文中使用 y y y表示上文中的 y ′ y' y′
感知器准则函数
本质是用对所有错分样本的求和来表示对错分样本的惩罚。
如果样本 y k y_k yk被错分,则有 α T y k < 0 \alpha^Ty_k<0 αTyk<0,因此可定义如下的感知准则函数:
J P ( α ) = ∑ y j ∈ γ k ( − α T y j ) J_P(\alpha)=\sum_{y_j∈\gamma^k} (-\alpha^Ty_j) JP(α)=yj∈γk∑(−αTyj)
其中, γ k \gamma^k γk是被 α \alpha α错分样本的集合。当且仅当 J P ( α ∗ ) = m i n J P ( α ) = 0 J_P(\alpha^*)=minJ_P(\alpha)=0 JP(α∗)=minJP(α)=0时,无错分样本。
感知器准则函数求解
梯度下降法(非单样本修正法):
α ( k + 1 ) = α ( k ) − ρ k ∇ J \alpha(k+1)=\alpha(k)-\rho_k\nabla J α(k+1)=α(k)−ρk∇J
其中, α ( k ) \alpha(k) α(k)表示第 k k k次迭代, ρ k \rho_k ρk为步长。表示下一时刻的权向量是把当前时刻的权向量向目标函数的负梯度方向调整一个修正量。
其中,
∇ J = ∂ J P ( α ) / ∂ α = ∑ y j ∈ γ k ( − y j ) \nabla J=∂J_P(\alpha)/∂\alpha=\sum_{y_j∈ \gamma^k}(-y_j) ∇J=∂JP(α)/∂α=yj∈γk∑(−yj)
因此,
α ( k + 1 ) = α ( k ) + ρ k ∑ y j ∈ γ k ( − y j ) \alpha(k+1)=\alpha(k)+\rho_k\sum_{y_j∈ \gamma^k}(-y_j) α(k+1)=α(k)+ρkyj∈γk∑(−yj)
表示每一步迭代时把错分的样本按照某个系数加到权向量上。
单样本修正法:
不难看出,梯度下降法(非单样本修正法)每次迭代必须遍历全部样本点,才能得到 α ( k ) \alpha(k) α(k)下的错分样本集 γ k \gamma^k γk,这是十分低效的,更 常用是每次只修正一个样本或一批样本的固定增量法。
单样本修正法把样本集看做一个不断重复出现的序列而逐个加以考虑。对于任意权向量 α ( k ) \alpha(k) α(k),如果把某个样本分错了, 则对 α ( k ) \alpha(k) α(k)做一次修正。
单样本修正法的修正过程:
-
固定增量法
(1)初值 α ( 0 ) \alpha(0) α(0)任意
(2)对样本 y j y_j yj,若 α ( k ) T y j < 0 \alpha(k)^Ty_j<0 α(k)Tyj<0,则 α ( k + 1 ) = α ( k ) + ρ k y j \alpha(k+1)=\alpha(k)+\rho_ky_j α(k+1)=α(k)+ρkyj,其中 ρ k \rho_k ρk一般取 1 1 1
(3)对所有样本重复(2),直至 J P = 0 J_P=0 JP=0
-
变增量法
ρ k \rho_k ρk会变化。
例如绝对修正法: ρ k = ∣ α ( k ) T y j ∣ ∣ ∣ y j ∣ ∣ 2 \rho_k=\frac{|\alpha(k)^Ty_j|}{||y_j||^2} ρk=∣∣yj∣∣2∣α(k)Tyj∣
不进行细致讲解。
收敛:对线性可分样本集,经过有限次修正后一定可以找到一个解 α ∗ \alpha^* α∗
利用感知准则实现多类判别
步骤:
(1)增广样本,但是不用进行规范化(注意和两分类问题的区别)
(2)每一类设定一个初始权向量
(3)对第 i i i类的样本 y i y_i yi,若 w i T y i < = w t T y i w_i^Ty_i<=w_t^Ty_i wiTyi<=wtTyi, t = 1 , . . . , M , t ≠ i t=1,...,M,t≠i t=1,...,M,t=i,则 { w i ( k + 1 ) = w i ( k ) + y i w t ( k + 1 ) = w t ( k ) − y i t ≠ i \left\{\begin{array}{l} w_i(k+1)=w_i(k)+y_i\\w_t(k+1)=w_t(k)-y_i & t≠i\end{array}\right. \space\space\space\space {wi(k+1)=wi(k)+yiwt(k+1)=wt(k)−yit=i
(4)对所有样本重复(3),直到满足 w i T y i > w t T y i w_i^Ty_i>w_t^Ty_i wiTyi>wtTyi, t = 1 , . . , M t=1,..,M t=1,..,M, t ≠ i t≠i t=i
注意,当存在修改时,只对不满足条件的 t t t对应的权向量进行修改,并非只要不满足(4)就要对全部权向量进行修改!
实验内容
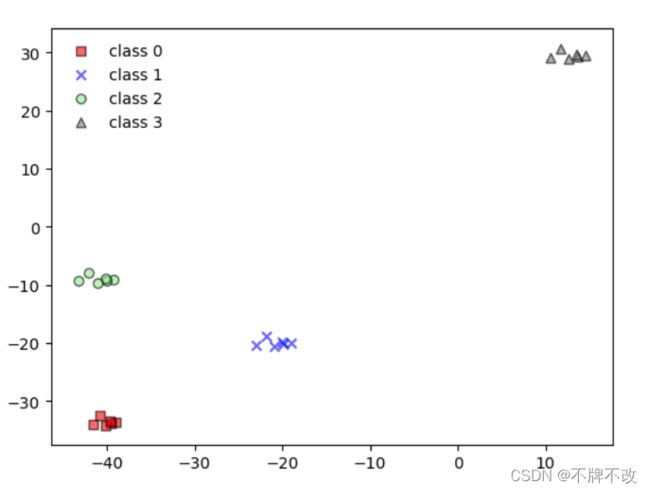
实验一:对高斯模型产生的随机数据进行分类(二维特征-四分类)
产生随机数据集
默认每个样本具有二维特征,总共产生4类,每类包括6个样本。
step1: 随机产生 ( x m i d , y m i d ) (x_{mid},y_{mid}) (xmid,ymid)作为每一类散点的中心;“中心点”生成算法中,要求不同类的中心点的间距大于一定的阈值才算有效中心点,否则将重新生成随机中心点。
中心点的作用是让接下来随机产生的每类样本都能以中心点为中心环绕分布。
step2: 随机生成 μ \mu μ和 σ \sigma σ,即高斯模型的均值与标准差,在一定范围内随机生成 μ \mu μ和 σ \sigma σ。
step3: 调用正态分布随机函数,传入随机生成的 μ \mu μ和 σ \sigma σ得到若干个满足正态分布的不同的随机值,作为偏置加到对应类的中心点上,得到每个样本的 ( x , y ) (x,y) (x,y),即两个特征值。
(下面展示的随机特征是在一定的随机种子下产生的固定随机值,后续也将以以下数据作为样例)
[[-38.91417124 -33.66110538]
 [-39.47727132 -33.86181856]
 [-41.54278021 -33.99513511]
 [-40.13845843 -34.22388901]
 [-39.56310397 -33.44689963]
 [-40.78871707 -32.46226414]
 [-18.95272644 -20.03351516]
 [-19.82651131 -20.22415869]
 [-23.03164387 -20.35078683]
 [-20.85250173 -20.56806429]
 [-19.95970126 -19.83005598]
 [-21.861534   -18.89481904]
 [-39.18566733  -9.08120016]
 [-40.05945219  -9.27184369]
 [-43.26458476  -9.39847183]
 [-41.08544262  -9.61574929]
 [-40.19264215  -8.87774097]
 [-42.09447489  -7.94250404]
 [ 14.5793832   29.49585749]
 [ 13.70559833  29.30521396]
 [ 10.50046577  29.17858582]
 [ 12.67960791  28.96130836]
 [ 13.57240838  29.69931667]
 [ 11.67057564  30.63455361]]

(24, 2)
感知器算法
由于该实验为多分类问题,所以无需进行规范化,只需要获取增广样本;
按上述规则,迭代更新权向量。
迭代次数: 5

# 迭代过程中更新的权向量
[array([[-278.53377919, -286.93045884,  300.        ],
       [ -11.15161665, -246.49569356,  450.        ],
       [-302.13993515,   63.15111502,  350.        ],
       [ 129.31846434,  226.34060159,  350.        ]]),
 array([[-278.53377919, -286.93045884,  300.        ],
       [ -11.15161665, -246.49569356,  450.        ],
       [-302.13993515,   63.15111502,  350.        ],
       [ 129.31846434,  226.34060159,  350.        ]]),
 array([[-278.53377919, -286.93045884,  300.        ],
       [ -11.15161665, -246.49569356,  450.        ],
       [-302.13993515,   63.15111502,  350.        ],
       [ 129.31846434,  226.34060159,  350.        ]]),
 array([[-278.53377919, -286.93045884,  300.        ],
       [ -11.15161665, -246.49569356,  450.        ],
       [-302.13993515,   63.15111502,  350.        ],
       [ 129.31846434,  226.34060159,  350.        ]]),
 array([[-278.53377919, -286.93045884,  300.        ],
       [ -11.15161665, -246.49569356,  450.        ],
       [-302.13993515,   63.15111502,  350.        ],
       [ 129.31846434,  226.34060159,  350.        ]])]

# 最终权向量
[[-278.53377919 -286.93045884  300.        ]
 [ -11.15161665 -246.49569356  450.        ]
 [-302.13993515   63.15111502  350.        ]
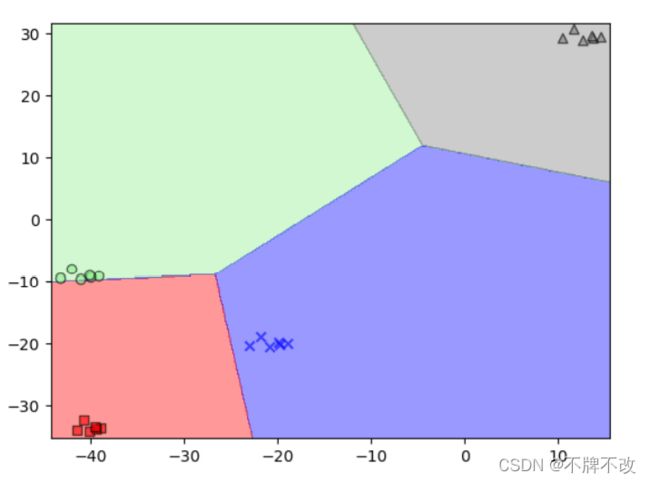
 [ 129.31846434  226.34060159  350.        ]]
绘制分界线
meshgrid生成网格后将点对代入得到的每一个权向量中计算,最大值对应的权向量所属的分类即为该点对(特征)对应的类别。
该模型还可以设置随机种子保证出现固定的随机数,方便观察数据。
实验二:感知机实现对鸢尾花数据集的二分类(四维特征-二分类)
鸢尾花数据集特点:
- 三种类别
- 每类50个样本,共150个样本
- 四维特征
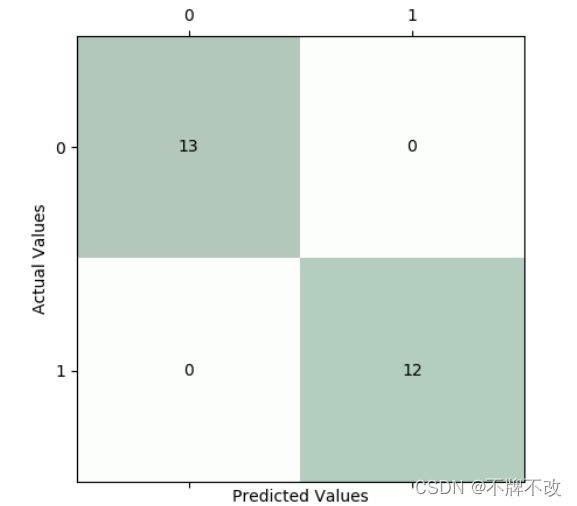
前100个样本对应于前两类样本,对前两类样本划分训练集与测试集,调用sklearn自带的Perceptron函数实现通过感知器分类。
用训练集训练模型,通过混淆矩阵观察测试集分类情况。
w:	[[-2.1 -7.9 11.3  5. ]]
b:	[-1.]
25%的测试集对应的混淆矩阵如下:
观察混淆矩阵可以发现,使用感知器算法对二分类的四维特征鸢尾花数据集进行分类的结果比较可观。
实验三:感知机实现对鸢尾花数据集的多分类(四维特征-三分类)
(该实验并未达到预期的效果)
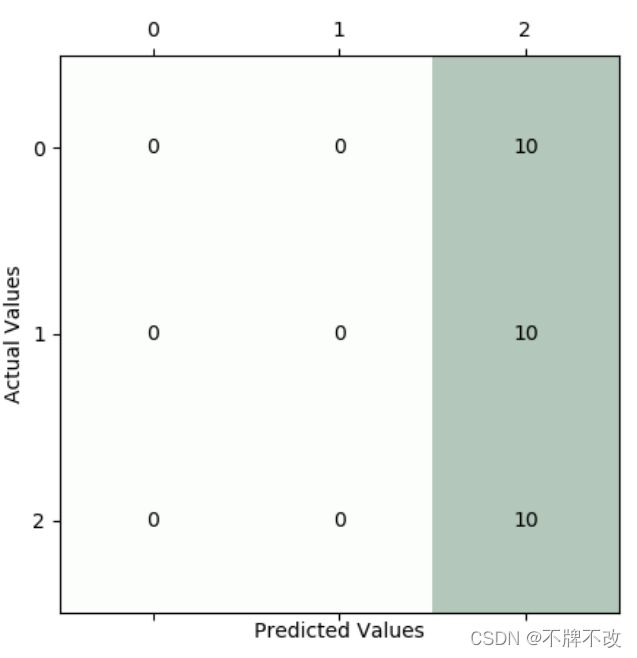
由于sklearn自带的Perceptron函数只能实现二分类,因此调用自定义的感知机函数以实现多分类(同实验一);但发现随着迭代次数的增加,不断更新权向量,会出现误判样本数增加后平稳的情况,即随着迭代次数的增加,预测反而增大了。
为解决该问题,我设置了阈值,即当误判样本点数小于一定的值就判定为算法结束,但由于误判样本数在最开始时最少,所以往往迭代不到5次就结束了,这也导致权向量无法正确对数据集进行分类。
测试集交叉报告:
迭代次数: 3
                 precision    recall  f1-score   support

    iris-setosa       0.00      0.00      0.00        10
iris-versicolor       0.00      0.00      0.00        10
 iris-virginica       0.33      1.00      0.50        10

       accuracy                           0.33        30
      macro avg       0.11      0.33      0.17        30
   weighted avg       0.11      0.33      0.17        30
测试集的混淆矩阵:
很显然,分类效果极差,分类器将前两类全部预测为第三类了。
同样的,对整个数据集进行分类。
数据集交叉报告:
                 precision    recall  f1-score   support

    iris-setosa       0.00      0.00      0.00        50
iris-versicolor       0.00      0.00      0.00        50
 iris-virginica       0.33      1.00      0.50        50

       accuracy                           0.33       150
      macro avg       0.11      0.33      0.17       150
   weighted avg       0.11      0.33      0.17       150
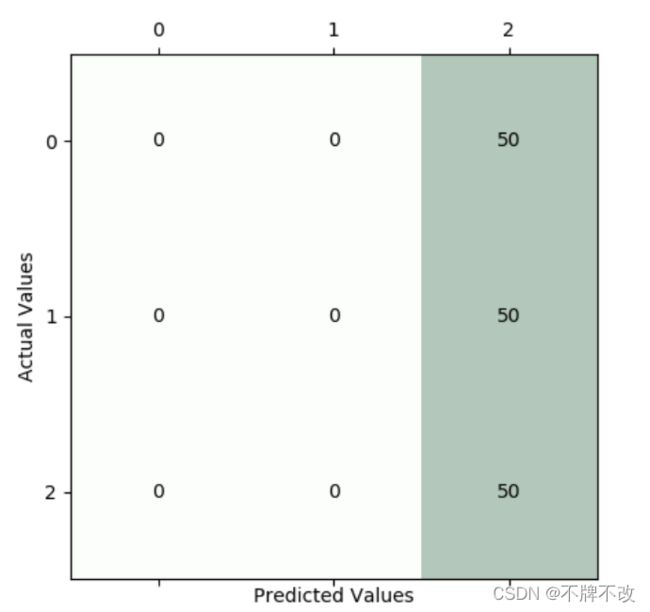
数据集的混淆矩阵:
整个数据集上出现了与测试集相同的情况,都没有很好的分类效果。
初步判断是三类并不具备线性可分的性质,导致感知机算法不收敛,最终无法结束迭代。
附录
实验一代码
"""

二特征 —— 多分类(4类)

多分类无需进行规范化,只有二分类需要进行规范化!

"""

import cmath
import numpy as np
import pandas as pd
import matplotlib.pyplot as plt

def generate_center_point(n = 4, distance_threshold = 15, lowup_bound = (-50, 50), random_seed=10):
    """
    产生随机的中心点
    :param n: 中心点组数
    :param distance_threshold: 每组中心点之间的距离阈值(允许的最小距离)
    :param lowup_bound: 为一个元组,限制中心点(x,y)的范围
    :param random_seed: 随机种子
    :return: 产生的中心点
    """
    np.random.seed(random_seed)
    centerpoints = []
    cur_n = 0

    while cur_n < n:
        x = np.random.randint(lowup_bound[0], lowup_bound[1]) + np.random.random() # 整数+浮点数
        y = np.random.randint(lowup_bound[0], lowup_bound[1]) + np.random.random()
        flag = True # 产生的该中心是否合理

        if len(centerpoints) == 0:
            pass
        else:
            for item in centerpoints:
                if np.linalg.norm(np.array(item)-np.array([x,y])) < distance_threshold: # 计算欧式距离 # 若新产生的中心点与已产生的中心点存在欧式距离小于阈值的情况
                    flag = False
                    break

        if bool(1-flag): # 说明产生的中心不合理 # python的bool取反 ”~“是错的
            continue
        # 说明产生的中心合理
        centerpoints.append([x,y])
        cur_n += 1

    return np.array(centerpoints)

def generate_single_classification(musigma_x, musigma_y, sample_num=6, random_seed=10):
    """
    产生若干个x方向和y方向的偏移
    :param musigma_x: 元组,x方向上的(mu, sigma)
    :param musigma_y: 元组,y方向上的(mu, sigma)
    :param sample_num: 每类的个数
    :param random_seed: 随机种子
    :return:
    """
    np.random.seed(random_seed)
    xs = np.random.normal(musigma_x[0], musigma_x[1], sample_num)
    ys = np.random.normal(musigma_y[0], musigma_y[1], sample_num)
    return np.append(np.array(xs).reshape(-1,1), np.array(ys).reshape(-1,1), axis=1)

def predict(weight_vector, data, base):
    """
    根据权向量和传入的data计算其所属类别
    :param weight_vector: 权向量
    :param data: 二维特征,根据base扩展为三维的,是为了计算类别
    :param base: 增广
    :return:
    """
    Z = []
    data = np.append(data, base*np.ones((len(data), 1)), axis=1) # 增广
    for item in data: # 对于每个样本,代入算式中最大的就是其所属类别
        max_value_idx = 0
        for idx in np.arange(0, len(weight_vector)):
            if np.dot(weight_vector[max_value_idx], item) <= np.dot(weight_vector[idx], item):
                max_value_idx = idx
        Z.append(max_value_idx)
    return np.array(Z)

def plot_all_group(weight_vector, X, Y, base, resolution=0.1): # 只能用于二特征样本的绘制
    """
    平面中绘制分界线
    :param weight_vector: 权向量 样本总数*3
    :param X: 样本特征 样本总数*2
    :param resolution:
    :return:
    """
    from matplotlib.colors import ListedColormap

    markers = ('s', 'x', 'o', '^', 'v')
    colors = ('red', 'blue', 'lightgreen', 'gray', 'cyan')
    cmap = ListedColormap(colors[:len(np.unique(Y))])

    x1_min, x1_max = X[:, 0].min() - 1, X[:, 0].max() + 1
    x2_min, x2_max = X[:, 1].min() - 1, X[:, 1].max() + 1
    xx1, xx2 = np.meshgrid(np.arange(x1_min, x1_max, resolution),
                           np.arange(x2_min, x2_max, resolution))
    Z = predict(weight_vector=weight_vector,
                data=np.array([xx1.ravel(), xx2.ravel()]).T,
                base=base)  # 转置后每行两个特征,行数为样本数
    Z = Z.reshape(xx1.shape)
    plt.contourf(xx1, xx2, Z, alpha=0.4, cmap=cmap)  # 绘制等高线,其实就是实现了区域的划分,同一类的Z值相等,即高度相等,颜色一样。
    plt.xlim(xx1.min(), xx1.max())
    plt.ylim(xx2.min(), xx2.max())

    for idx, cl in enumerate(np.unique(Y)):
        plt.scatter(x=X[Y == cl, 0],
                    y=X[Y == cl, 1],
                    alpha=0.6, # 透明度
                    c=cmap(idx),
                    edgecolor='black',
                    marker=markers[idx],
                    label=cl)
    plt.show()

def generate_all_classification(group_num = 4, sample_of_group = 6, random_seed=10):
    """
    默认随机生成4组数据,每组6个样本
    :param group_num: 类别数
    :param sample_of_group: 每类的样本数
    :param random_seed: 随机种子
    :return:
    """
    from matplotlib.colors import ListedColormap

    np.random.seed(random_seed)
    allpoints = []
    centerpoints = generate_center_point(n=group_num,
                                         distance_threshold=15,
                                         lowup_bound=(-50,50),
                                         random_seed=random_seed)

    for item in centerpoints: # 每次循环得到一类的若干点
        mu_x = np.random.random()*0.5+0.3     # (0.3, 0.8)
        mu_y = np.random.random()*0.5+0.3     # (0.3, 0.8)
        sigma_x = np.random.random()*1+0.5    # (0.5, 1.5)
        sigma_y = np.random.random()*1+0.5    # (0.5, 1.5)
        points = np.array([item.tolist()] * sample_of_group) + generate_single_classification(musigma_x=(mu_x, sigma_x),
                                                                                              musigma_y=(mu_y, sigma_y),
                                                                                              sample_num=6)
        for p in points.tolist():
            allpoints.append(p)

        # plt.plot(points[:, 0], points[:, 1], '*') # 绘制

    X = np.array(allpoints)
    Y = []
    for i in np.arange(0, group_num):
        Y.append((i*np.ones(sample_of_group, dtype=int)).tolist())
    Y = np.array(Y).ravel()

    markers = ('s', 'x', 'o', '^', 'v')
    colors = ('red', 'blue', 'lightgreen', 'gray', 'cyan')
    cmap = ListedColormap(colors[:len(np.unique(Y))])
    for idx, cl in enumerate(np.unique(Y)):
        plt.scatter(x=X[Y == cl, 0],
                    y=X[Y == cl, 1],
                    alpha=0.6, # 透明度
                    c=cmap(idx),
                    edgecolor='black',
                    marker=markers[idx],
                    label=cl)

    plt.legend(['class 0', 'class 1', 'class 2', 'class 3', 'class 4'], loc='best', frameon=False)
    plt.show()

    return np.array(allpoints)

def perceptron(n=4, sample_num=6, initial_weight_vector=[50.0, 50.0, 50.0], c=1, random_seed=10):
    """

    :param n: 类别总数
    :param sample_num: 每类多少样本
    :param initial_weight_vector: 初始权向量
    :param c: 修正步长
    :param random_seed: 随机种子
    :return: 迭代过程中产生的权向量 和 最终权向量
    """
    base = 50 # 增广
    allpoints = generate_all_classification(group_num=n, sample_of_group=sample_num, random_seed=random_seed) # 全部的随机点
    allpoints = np.append(allpoints, base*np.ones((n*sample_num, 1)), axis=1) # 增广
    initial_weight_vector = np.array([initial_weight_vector] * n) # 初始权向量
    end_weight_vector = initial_weight_vector
    iteration_weight_vector = [] # 迭代过程中的权向量变化(元素为ndarray的list)
    iteration_times = 0  # 迭代次数

    while True:
        cnt = 0
        for cl in np.arange(0, n): # 每一个类别
            for sample in np.arange(0, sample_num): # 每一个样本
                # 对于该样本而言,只要存在一个非对应权向量与之的内积不小于对应权向量与之的内积,就一定要修改该非对应权向量和对应权向量
                # 非对应权向量可以在比较中直接修改;由于可能存在多个非对应权向量与之的内积不小于对应权向量与之的内积的情况,但对应权向量只会修改一次
                # 因此,对应权向量的修改应该发生在遍历全部权向量外层的循环中
                flag = False # 判断是否需要修改该样本对应的权向量

                for vector in np.arange(0, n):
                    if cl == vector:
                        continue

                    value1 = np.dot(end_weight_vector[cl],
                                    allpoints[cl*sample_num+sample]) # end_weight_vector[cl]为该样本对应的权向量
                    value2 = np.dot(end_weight_vector[vector],
                                    allpoints[cl*sample_num+sample]) # end_weight_vector[vector]为非该样本对应的权向量
                    if value1 <= value2 + 0.5:
                        # 对于某个样本而言,如果该样本类别的w与该样本的内积小于等于某个样本类别的w与该样本的内积
                        # 则需要对某个样本类别的w进行修改一次,并对该样本类别的w修改一次
                        end_weight_vector[vector] -= c*allpoints[cl*sample_num+sample]
                        cnt += 1
                        flag = True

                    if flag: # 修改该样本对应的权向量
                        end_weight_vector[cl] += c*allpoints[cl*sample_num+sample]
                        pass
        if cnt == 0: # 对于全部样本而言都无需再修改权向量
            print('迭代次数:', iteration_times)
            break

        iteration_times += 1
        iteration_weight_vector.append(end_weight_vector) # 加入这一轮得到的权向量

    Y = []
    for i in np.arange(0, n):
        Y.append(i*np.ones(sample_num, dtype=int))

    plot_all_group(weight_vector=end_weight_vector, X=allpoints[:,:-1], Y=np.array(Y).ravel(), base=base) # 绘制分界线

    return iteration_weight_vector, end_weight_vector

if __name__ == '__main__':
    random_seed = np.random.randint(0, 10000) # 真随机
    iteration_weight_vector, end_weight_vector = perceptron(random_seed=10) # 可以自定义随机种子,如果想完全随机,则可以使用上面的random_seed
    # print(iteration_weight_vector)
    # print(end_weight_vector)
实验二代码
"""
感知机实现对鸢尾花数据集进行二分类(四特征)
"""
import pandas as pd
import numpy as np
from sklearn.datasets import load_iris
from sklearn.linear_model import  Perceptron
from sklearn.model_selection import train_test_split


def plot_confusion_matrix(test_label_original, test_label_predict): # 混淆矩阵
    import matplotlib.pyplot as plt

    from sklearn.metrics import confusion_matrix
    cm = confusion_matrix(test_label_original, test_label_predict)
    fig, ax = plt.subplots(figsize=(5, 5))
    ax.matshow(cm, cmap=plt.cm.Greens, alpha=0.3)
    for i in range(cm.shape[0]):
        for j in range(cm.shape[1]):
            ax.text(x=j, y=i,
                    s=cm[i, j],
                    va='center', ha='center')
    plt.xlabel('Predicted Values')
    plt.ylabel('Actual Values')
    plt.show()


if __name__ == '__main__':
    iris = load_iris()

    df = pd.DataFrame(iris.data,columns=iris.feature_names)

    # 前100行为两类样本
    x = np.array(df.iloc[:100,:])       # 特征
    y = iris.target[:100]               # 标签
    y = np.array([1 if i ==1 else -1 for i in y])
    X_train, X_test, Y_train, Y_test = train_test_split(x, y, test_size=0.25)
    clf = Perceptron(fit_intercept=True,max_iter=1000,shuffle=False) # 感知器
    clf.fit(X_train, Y_train)
    print(clf.coef_)        # 求出权重向量参数值
    print(clf.intercept_)   # 求出截距项参数值
    plot_confusion_matrix(Y_test, clf.predict(X_test))
实验三代码
"""
!!!得不到比较合适的权向量!!!
观察混淆矩阵可以发现,只能分出第三类,其他两类完全被误分到第三类了
也就是说这个模型对于鸢尾花数据集多分类效果极差


鸢尾花数据集:三分类,每类50个样本,四特征
"""
import numpy as np
from sklearn.datasets import load_iris

def load_dataSet():
    from sklearn.model_selection import train_test_split

    iris = load_iris()
    X, Y = iris.data, iris.target
    X_train, X_test, Y_train, Y_test = train_test_split(X, Y, test_size=0.2, stratify=Y)
    return X, Y, X_train, X_test, Y_train, Y_test

def perceptron(X, Y, n, sample_num, initial_weight_vector, c, base=5.0, threshold=0.05):
    end_weight_vector = np.array([initial_weight_vector] * n)
    X_extend = np.append(np.array(X), base*np.ones((n*sample_num, 1)), axis=1) # 增广
    iteration_times = 0  # 迭代次数

    while True:
        cnt = 0
        for cl in np.arange(0, n): # 每一个类别
            for sample in np.arange(0, sample_num): # 每一个样本
                # 对于该样本而言,只要存在一个非对应权向量与之的内积不小于对应权向量与之的内积,就一定要修改该非对应权向量和对应权向量
                # 非对应权向量可以在比较中直接修改;由于可能存在多个非对应权向量与之的内积不小于对应权向量与之的内积的情况,但对应权向量只会修改一次
                # 因此,对应权向量的修改应该发生在遍历全部权向量外层的循环中
                flag = False # 判断是否需要修改该样本对应的权向量

                for vector in np.arange(0, n):
                    if cl == vector:
                        continue

                    value1 = np.dot(end_weight_vector[cl],
                                    X_extend[cl*sample_num+sample]) # end_weight_vector[cl]为该样本对应的权向量
                    value2 = np.dot(end_weight_vector[vector],
                                    X_extend[cl*sample_num+sample]) # end_weight_vector[vector]为非该样本对应的权向量
                    if value1 <= value2 + 0.5:
                        # 对于某个样本而言,如果该样本类别的w与该样本的内积小于等于某个样本类别的w与该样本的内积
                        # 则需要对某个样本类别的w进行修改一次,并对该样本类别的w修改一次
                        end_weight_vector[vector] -= c*X_extend[cl*sample_num+sample]
                        cnt += 1
                        flag = True

                    if flag: # 修改该样本对应的权向量
                        end_weight_vector[cl] += c*X_extend[cl*sample_num+sample]
                        pass

        if cnt <= threshold*X.shape[0]: # 当小于阈值时,视为结束
            print('迭代次数:', iteration_times)
            break

        iteration_times += 1

    return end_weight_vector

def predict(X, weight_vector, base):
    Z = []
    data = np.append(X, base * np.ones((len(X), 1)), axis=1)  # 增广
    for item in data:  # 对于每个样本,代入算式中最大的就是其所属类别
        max_value_idx = 0
        for idx in np.arange(0, len(weight_vector)):
            if np.dot(weight_vector[max_value_idx], item) <= np.dot(weight_vector[idx], item):
                max_value_idx = idx
        Z.append(max_value_idx)

    return np.array(Z)

def plot_confusion_matrix(test_label_original, test_label_predict): # 混淆矩阵
    import matplotlib.pyplot as plt

    from sklearn.metrics import confusion_matrix
    cm = confusion_matrix(test_label_original, test_label_predict)
    fig, ax = plt.subplots(figsize=(5, 5))
    ax.matshow(cm, cmap=plt.cm.Greens, alpha=0.3)
    for i in range(cm.shape[0]):
        for j in range(cm.shape[1]):
            ax.text(x=j, y=i,
                    s=cm[i, j],
                    va='center', ha='center')
    plt.xlabel('Predicted Values')
    plt.ylabel('Actual Values')
    plt.show()

def evaluate_model(test_label_original, test_label_predict):
    from sklearn.metrics import classification_report

    print(classification_report(test_label_original,
                                test_label_predict,
                                target_names=['iris-setosa', 'iris-versicolor', 'iris-virginica'])) # 交叉报告

    plot_confusion_matrix(test_label_original, test_label_predict)

if __name__ == '__main__':
    X, Y, X_train, X_test, Y_train, Y_test = load_dataSet()
    init_weight_vector_value = -1.0
    base = 1.0
    weight_vector = perceptron(X=X_train,
                               Y=Y_train,
                               n=len(np.unique(Y_train)),
                               sample_num=len(Y_train)//len(np.unique(Y_train)),
                               initial_weight_vector=(init_weight_vector_value*np.ones(X_train.shape[1]+1)).tolist(),
                               c=0.5,
                               base=base,
                               threshold=0.05)
    # 测试集
    Y_predict = predict(X=X_test, weight_vector=weight_vector, base=base)
    evaluate_model(Y_test, Y_predict)
    # 全部数据
    Y_predict = predict(X=X, weight_vector=weight_vector, base=base)
    evaluate_model(Y, Y_predict)
