机器学习实验-波士顿房价预测
-
- 1 波士顿房价预测
-
- 1.2 实验代码
-
- 1.2.1 引入依赖包
- 1.2.2 加载数据集,查看数据属性,可视化
- 1.2.3 分割数据集,并对数据集进行预处理
- 1.2.4 利用各类回归模型,对数据集进行建模
- 1.2.5 利用网格搜索对超参数进行调节
- 1.3 笔记
1 波士顿房价预测
1.2 实验代码
1.2.1 引入依赖包
import warnings
warnings.filterwarnings('ignore')
import numpy
import matplotlib as mpl
import matplotlib.pyplot as plt
import pandas as pd
import seaborn as sns
import scipy.stats as st
mpl.rcParams['font.sans-serif'] = [u'SimHei']
mpl.rcParams['axes.unicode_minus'] = False
from sklearn.preprocessing import StandardScaler
from sklearn.model_selection import GridSearchCV
from sklearn.model_selection import train_test_split
from sklearn.metrics import r2_score
from sklearn.datasets import load_boston
from sklearn.linear_model import LinearRegression,RidgeCV,LassoCV,ElasticNet
from sklearn.svm import SVR
from sklearn.ensemble import RandomForestRegressor,GradientBoostingRegressor
from xgboost import XGBRegressor
1.2.2 加载数据集,查看数据属性,可视化
boston = load_boston()
x = boston.data
y = boston.target
print('特征的列名')
print(boston.feature_names)
print('样本数据量:%d, 特征个数:%d' %x.shape)
print('标签样本数据量:%d' %y.shape[0])
特征的列名
['CRIM' 'ZN' 'INDUS' 'CHAS' 'NOX' 'RM' 'AGE' 'DIS' 'RAD' 'TAX' 'PTRATIO'
 'B' 'LSTAT']
样本数据量:506, 特征个数:13
标签样本数据量:506
x = pd.DataFrame(boston.data, columns=boston.feature_names)
x.head()
|
CRIM |
ZN |
INDUS |
CHAS |
NOX |
RM |
AGE |
DIS |
RAD |
TAX |
PTRATIO |
B |
LSTAT |
| 0 |
0.00632 |
18.0 |
2.31 |
0.0 |
0.538 |
6.575 |
65.2 |
4.0900 |
1.0 |
296.0 |
15.3 |
396.90 |
4.98 |
| 1 |
0.02731 |
0.0 |
7.07 |
0.0 |
0.469 |
6.421 |
78.9 |
4.9671 |
2.0 |
242.0 |
17.8 |
396.90 |
9.14 |
| 2 |
0.02729 |
0.0 |
7.07 |
0.0 |
0.469 |
7.185 |
61.1 |
4.9671 |
2.0 |
242.0 |
17.8 |
392.83 |
4.03 |
| 3 |
0.03237 |
0.0 |
2.18 |
0.0 |
0.458 |
6.998 |
45.8 |
6.0622 |
3.0 |
222.0 |
18.7 |
394.63 |
2.94 |
| 4 |
0.06905 |
0.0 |
2.18 |
0.0 |
0.458 |
7.147 |
54.2 |
6.0622 |
3.0 |
222.0 |
18.7 |
396.90 |
5.33 |
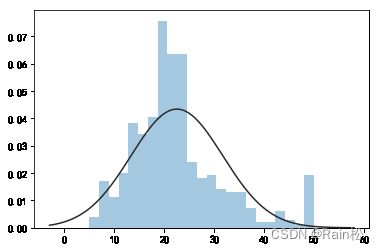
sns.distplot(tuple(y), kde=False, fit=st.norm)

1.2.3 分割数据集,并对数据集进行预处理
x_train,x_test,y_train,y_test = train_test_split(x, y, test_size=0.2, random_state=28)
ss = StandardScaler()
x_train = ss.fit_transform(x_train)
x_test = ss.transform(x_test)
x_train[0:100]
array([[-0.35703125, -0.49503678, -0.15692398, ..., -0.01188637,
         0.42050162, -0.29153411],
       [-0.39135992, -0.49503678, -0.02431196, ...,  0.35398749,
         0.37314392, -0.97290358],
       [ 0.5001037 , -0.49503678,  1.03804143, ...,  0.81132983,
         0.4391143 ,  1.18523567],
       ...,
       [-0.34697089, -0.49503678, -0.15692398, ..., -0.01188637,
         0.4391143 , -1.11086682],
       [-0.39762221,  2.80452783, -0.87827504, ...,  0.35398749,
         0.4391143 , -1.28120919],
       [-0.38331362,  0.41234349, -0.74566303, ...,  0.30825326,
         0.19472652, -0.40978832]])
1.2.4 利用各类回归模型,对数据集进行建模
names = [
'线性回归',
'岭回归',
'Lasso回归',
'随机森林',
'梯度提升树GBDT',
'支持向量机',
'弹性网络',
'XGBoost'
]
models = [
LinearRegression(),
RidgeCV(alphas=(0.001, 0.1, 1), cv=3),
LassoCV(alphas=(0.001, 0.1, 1), cv=5),
RandomForestRegressor(n_estimators=10),
GradientBoostingRegressor(n_estimators=30),
SVR(C=5, kernel='rbf', gamma=0.1),
ElasticNet(alpha=0.001, max_iter=10000),
XGBRegressor()
]
def R2(model, x_train, x_test, y_train, y_test):
model_fitted = model.fit(x_train, y_train)
y_pred = model_fitted.predict(x_test)
return r2_score(y_test, y_pred)
for name,model in zip(names, models):
score = R2(model, x_train, x_test, y_train, y_test)
print('{}: {:.6f}, {:.4f}'.format(name, score.mean(), score.std()))
线性回归: 0.564115, 0.0000
岭回归: 0.563673, 0.0000
Lasso回归: 0.564049, 0.0000
随机森林: 0.716249, 0.0000
梯度提升树GBDT: 0.733582, 0.0000
支持向量机: 0.618320, 0.0000
弹性网络: 0.563992, 0.0000
XGBoost: 0.761123, 0.0000
1.2.5 利用网格搜索对超参数进行调节
'''
超参数
'kernel': 核函数
'C': SVR的正则化因子
'gamma': 'rbf','ploy', 'sigmoid'核函数的系数,影响模型性能
'''
params = {
'kernel': ['rbf', 'linear'],
'C': [0.1, 0.5, 0.9, 1, 5],
'gamma': [0.001, 0.01, 0.1, 1]
}
model = GridSearchCV(SVR(), param_grid=params, cv=3)
model.fit(x_train, y_train)
print('最优参数列表:', model.best_params_)
print('最优模型:', model.best_estimator_)
print('最优R2值:', model.best_score_)
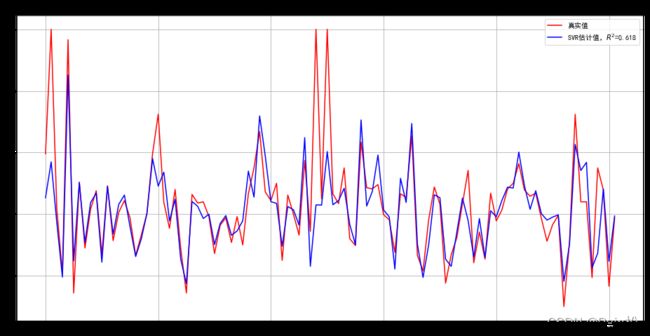
ln_x_test = range(len(x_test))
y_pred = model.predict(x_test)
plt.figure(figsize=(16,8))
plt.plot(ln_x_test, y_test, 'r-', label=u'真实值')
plt.plot(ln_x_test, y_pred, 'b-', label=u'SVR估计值,$R^2$=%.3f' %model.best_score_)
plt.legend(loc='upper right')
plt.grid(True)
plt.title(u'波士顿房价预测-支持向量机')
plt.show()
最优参数列表: {'C': 5, 'gamma': 0.1, 'kernel': 'rbf'}
最优模型: SVR(C=5, cache_size=200, coef0=0.0, degree=3, epsilon=0.1, gamma=0.1,
  kernel='rbf', max_iter=-1, shrinking=True, tol=0.001, verbose=False)
最优R2值: 0.7963412572047208

1.3 笔记


