关于Python进行数据分析绘图的那些事儿一
今天记录一些利用python的基本绘图操作:
大家有用的话,可以自取~
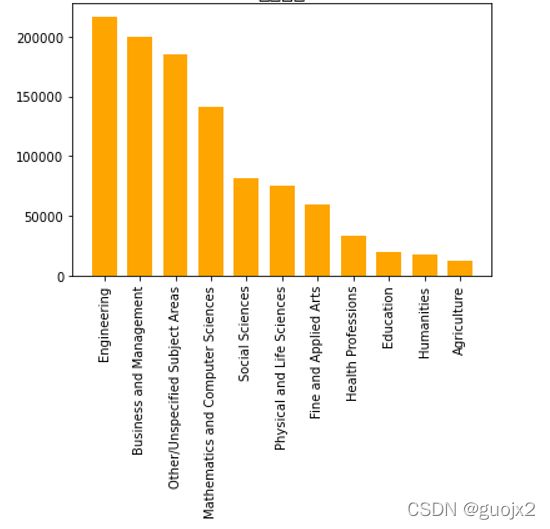
1.柱状图
import pandas as pd
import matplotlib.pyplot as plt

students = pd.read_excel('E:/Students.xlsx')
students.sort_values(by='Number', inplace=True, ascending=False)
students.index = range(0, len(students))
print(students)

# 使用这个函数画图更好看
plt.bar(students['Field'], students['Number'], color='orange', width=0.7)
plt.bar(students.Field, students.Number, color='orange', width=0.7)
plt.xticks(students['Field'], rotation='90')# 标签旋转90度
#如何写中文的图名,还要再次研究一下,其实也可以使用其他软件P上去
plt.title('International students by Field', fontsize=16)# 设置图名,中文会报错
# X轴和Y轴的名字
plt.xlabel('Field')
plt.ylabel('Number')
# plt.tight_layout()# 紧凑型布局,将标签显示完全,但是会压缩上面图的部分
plt.show()

students = pd.read_excel('E:/Students.xlsx')
#进行排序,通过数字进行排序,从大到小排列
students.sort_values(by='Number', inplace=True, ascending=False)
# 打印图片的时候可以设置条件
students.plot.bar(x='Field',y='Number',color='orange')#打印图片,X轴是什么,Y轴是什么
plt.show()#用来显示图片
形成的图如下所示:
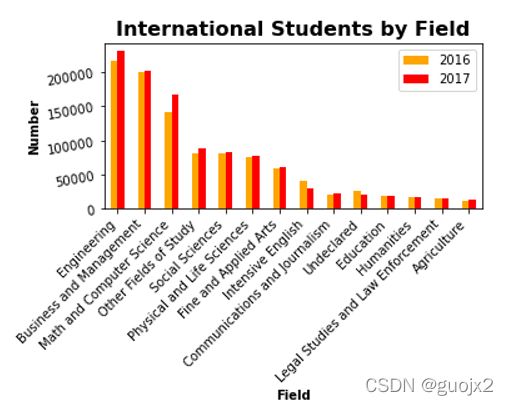
2.分组柱状图
使用分组柱状图的时候,还要进行数据筛选,代码如下:
import pandas as pd
import matplotlib.pyplot as plt

students = pd.read_excel('E:/Students.xlsx')
print(students)
students.sort_values(by='2017', inplace=True, ascending=False)
print(students)
students.plot.bar('Field', ['2016', '2017'], color=['orange', 'Red'])
plt.title('International Students by Field', fontsize=16)
plt.xlabel('Field', fontweight='bold')
plt.ylabel('Number', fontweight='bold')
# plt.tight_layout()
ax = plt.gca()
ax.set_xticklabels(students['Field'], rotation=40, ha='right')
plt.gcf().subplots_adjust(left=0.2, bottom=0.42)
plt.show()
形成图如下所示:
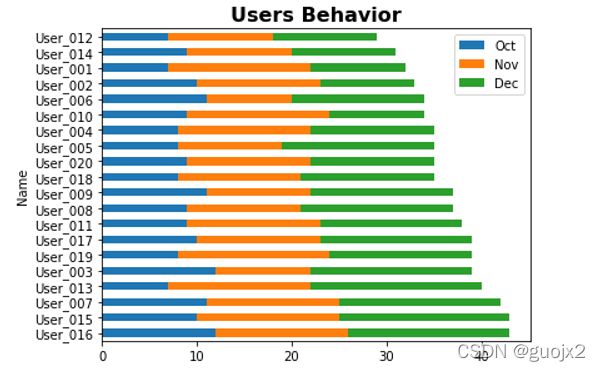
3. 叠加水平柱状图
import pandas as pd
import matplotlib.pyplot as plt

users = pd.read_excel('E:/Users.xlsx')
print(users)
users['Total'] = users['Oct'] + users['Nov'] + users['Dec']
users.sort_values(by='Total', inplace=True, ascending=False)#ascending=True可以变成由大到小排列
print(users)
# users.plot.bar(x='Name',y=['Oct', 'Nov', 'Dec'])# 这个是绘制的分组柱状图
users.plot.bar(x='Name', y=['Oct', 'Nov', 'Dec'], stacked=True)
# 添加h表示绘制水平的图,ascending=False此时还是从上到下由小到大排列
users.plot.barh(x='Name', y=['Oct', 'Nov', 'Dec'], stacked=True)
# stacked=True,这个函数是用来将三列数据叠加到一起,形成一列数据的
# 如果想把这个数据按照高低排,上面还要加上筛选的语句
plt.tight_layout()
plt.title('Users Behavior', fontsize=16, fontweight='bold')
plt.show()
如下所示:
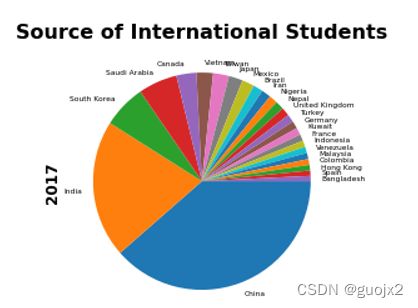
4.饼图
import pandas as pd
import matplotlib.pyplot as plt

students = pd.read_excel('E:/Students.xlsx', index_col='From')
print(students)
# 因为2017比较特殊,所以要用方括号,要不然可以直接students.From
# 绘制饼图
students.sort_values(by='2017', inplace=True, ascending=False)#ascending=True可以变成由大到小排列

#students['2017'].plot.pie(fontsize=6, counterclock=False, startangle=-270)
students['2017'].plot.pie(fontsize=6, counterclock=False)
# startangle=-270,设定起始点;counterclock=False,设定顺时针旋转,就不需要排序了
plt.title('Source of International Students', fontsize=16, fontweight='bold')
plt.ylabel('2017', fontsize=12, fontweight='bold')
plt.show()
如下所示
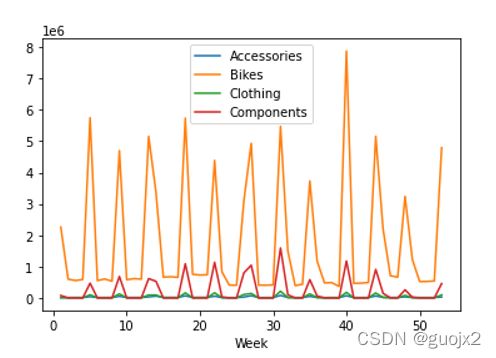
5.折线图
import pandas as pd
import matplotlib.pyplot as plt
weeks = pd.read_excel('E:/Orders.xlsx', index_col='Week')
print(weeks)
# plot是绘制折线图,画几列写几个数
weeks.plot(y=['Accessories', 'Bikes', 'Clothing', 'Components'])
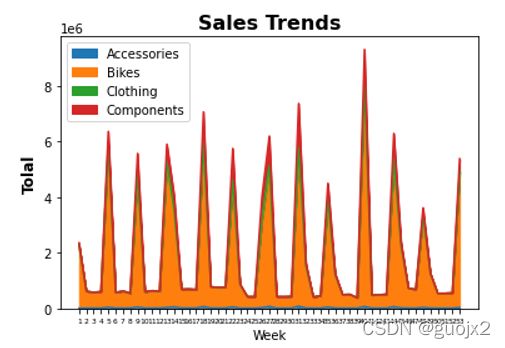
# 叠加区域图
weeks.plot.area(y=['Accessories', 'Bikes', 'Clothing', 'Components'])
plt.title('Sales Trends', fontsize=16, fontweight='bold')
plt.ylabel('Tolal', fontsize=12, fontweight='bold')
plt.xticks(weeks.index, fontsize=6)#重新铺一下横轴的标签
plt.show()如下所示: