【机器学习超详细】机器学习案例之SVM人脸识别技术应用 PCA降维 结果可视化 支持向量机
基础知识介绍:
LFW人脸识别数据集(http://vis-www.cs.umass.edu/lfw/)
该实验可以在JupyterNotebook上运行,也可在其他Python程序上运行。(本人习惯用于JupyterNotebook)
该实验可用SVM技术进行人脸识别,通过不断调参增加人脸识别技术的准确性。
LWF数据库介绍:
LFW (Labled Faces in the Wild)人脸数据集:是目前人脸识别的常用测试集,其中提供的人脸图片均来源于生活中的自然场景,因此识别难度会增大,尤其由于多姿态、光照、表情、年龄、遮挡等因素影响导致即使同一人的照片差别也很大。并且有些照片中可能不止一个人脸出现,对这些多人脸图像仅选择中心坐标的人脸作为目标,其他区域的视为背景干扰。LFW数据集共有13233张人脸图像,每张图像均给出对应的人名,共有5749人,且绝大部分人仅有一张图片。 每张图片的尺寸为250X250,绝大部分为彩色图像,但也存在少许黑白人脸图片。
LFW (Labeled Faces in the Wild)人脸数据库是由美国马萨诸塞州立大学阿默斯特分校计算机视觉实验室整理完成的数据库,主要用来研究非受限情况下的人脸识别问题。LFW数据库主要是从互联网上搜集图像,而不是实验室,- 共含有13000 多张人脸图像,每张图像都被标识出对应的人的名字,其中有1680 人对应不只一张图像,即大约1680个人包含两个以上的人脸。
LFW数据集主要测试人脸识别的准确率,该数据库从中随机选择了6000对人脸组成了人脸辨识图片对,其中3000对属于同一个人2张人脸照片,3000对属于不同的人每人1张人脸照片。测试过程LFW给出一对照片,询问测试中的系统两张照片是不是同一个人,系统给出“是”或“否”的答案。通过6000对人脸测试结果的系统答案与真实答案的比值可以得到人脸识别准确率。
这个集合被广泛应用于评价face verification算法的性能。
实验步骤及讲解:
一、导入所需的库
import matplotlib.pyplot as plt  #matplotlib画图库
from sklearn.model_selection import train_test_split #拆分数据集
from sklearn.datasets import fetch_lfw_people #导入LFW人脸数据集
from sklearn.model_selection import GridSearchCV #导入网格搜索
from sklearn.metrics import classification_report #导入精度、召回率、F1
from sklearn.svm import SVC #导入SVM库
from sklearn.decomposition import PCA #导入PCA降维库
- import matplotlib.pyplot as plt: python+matplotlib = matlab matplotlib为python中的画图库
- from sklearn.model_selection import train_test_split: 拆分数据集
- from sklearn.datasets import fetch_lfw_people: 导入LFW人脸数据集
- from sklearn.model_selection import GridSearchCV: GridSearchCV为网格搜索库,该命令导入网格搜索库 有关网格搜索内容可看https://blog.csdn.net/weixin_50989751/article/details/123936293?spm=1001.2014.3001.5501
- from sklearn.metrics import classification_report: 导入精度、召回率、F1分数库
- from sklearn.svm import SVC: 导入支持向量机
- from sklearn.decomposition import PCA : 导入PCA降维库
有关网格搜索内容可看https://blog.csdn.net/weixin_50989751/article/details/123936293?spm=1001.2014.3001.5501
有关精度、召回率、F1函数内容可看https://blog.csdn.net/weixin_50989751/article/details/123869133?spm=1001.2014.3001.5501
二、载入数据:
lfw_people = fetch_lfw_people(min_faces_per_person = 70,resize = 0.4)
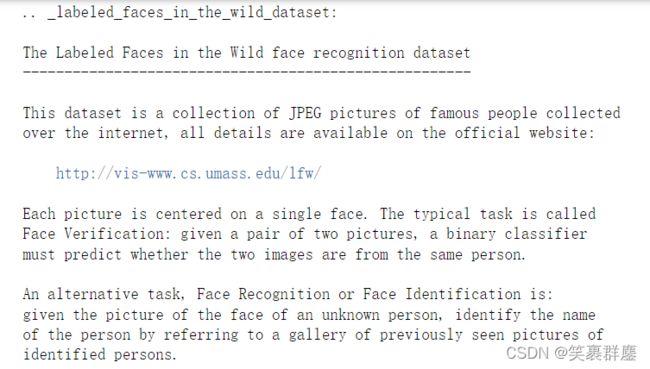
查看LFW人脸数据集讲解:
print(lfw_people.DESCR)
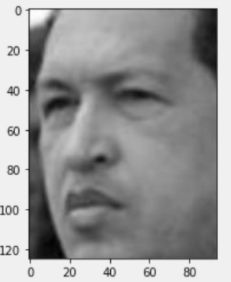
三、导出一张图片进行讲解:
plt.imshow(lfw_people.images[0],cmap = "gray")
plt.show()
查看照片的数据格式:
n_samples,h,w = lfw_people.images.shape
pri
print(h)
print(w)
结果为:
1288
50
37
命令解释:
- n_samples:图像的个数
- h: 图片的宽度
- w: 图片的长度
lfw_people.data.shape
结果为:
(1288, 1850)
结果表示为:有1288张图像,数据特征有1850个。
四、查看数据标签
4.1 类别里面有谁的名字
target_names = lfw_people.target_names
target_names
结果为:
array(['Ariel Sharon', 'Colin Powell', 'Donald Rumsfeld', 'George W Bush',
       'Gerhard Schroeder', 'Hugo Chavez', 'Tony Blair'], dtype=')
4.2 数据集中有多少人需要区分
n_classes = lfw_people.target_names.shape[0]
n_classes
结果为:
7
表示有7个人需要区分
五、拆分训练集与测试集实例化
x_train,x_test,y_train,y_test = train_test_split(lfw_people.data,lfw_people.target)
六、建立SVM分类模型
6.1 模型实例化
model = SVC(kernel = 'rbf',class_weight = 'balanced')
6.2 模型训练
model.fit(x_train,y_train)
6.3 模型预测
predictions = model.predict(x_test)
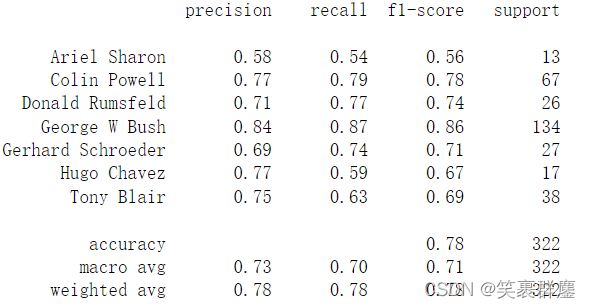
6.4 模型评估
print(classification_report(y_test,predictions,target_names=lfw_people.target_names))
七、PCA降维
7.1 100个维度
n_components = 100
7.2 建立PCA模型
pca = PCA(n_components = n_components,whiten = True).fit(lfw_people.data)
7.3 将特征向量转化成低维矩阵
x_train_pca = pca.transform(x_train)
x_test_pca = pca.transform(x_test)
x_train_pca.shape
结果为:
(996,100)
7.4 模型实例化
model = SVC(kernel = 'rbf',class_weight = 'balanced')
7.5 模型训练
model.fit(x_train_pca,y_train)
结果为:
SVC(class_weight='balanced')
7.6 模型预测
predictions = model.predict(x_test_pca)
7.7 模型评估
print(classification_report(y_test,predictions,target_names = target_names))
结果为:
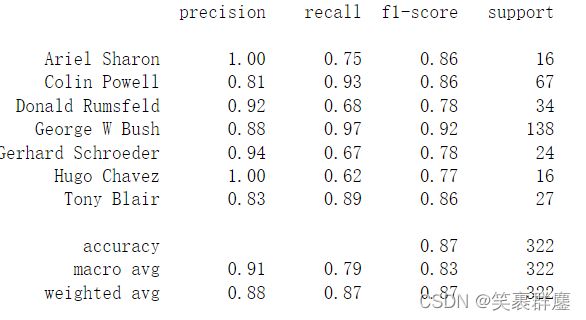
通过与6.4对比 accuracy 、 macro avg 、weighted avg值发现,降维后人脸识别准确率有了增长。
【提示】:各位博主可通过更改降维值发现准确率是否提升,在此我只将维度降为100,各位可以进行尝试。
八、网格搜索
8.1 网格搜索调参
param_grid = {'C':[0.1,1,5,10,100],
              'gamma':[0.005,0.001,0.005,0.01],}
命令解释:
- C: 错误惩罚权重
- gamma:建立核函数的不同比例
8.2 模型实例化
model = GridSearchCV(SVC(kernel = 'rbf',class_weight = 'balanced'),param_grid)
【注】:选择核函数,建SVC,尝试运行,获取最好参数
8.3 模型训练
model.fit(x_train_pca,y_train)
8.4输出最佳参数:
print(model.best_estimator_)
结果为:
SVC(C=1, class_weight='balanced', gamma=0.005)
8.5 模型预测:
predictions = model.predict(x_test_pca)
8.6 模型评估
print(classification_report(y_test,predictions,target_names = target_names))
结果为:
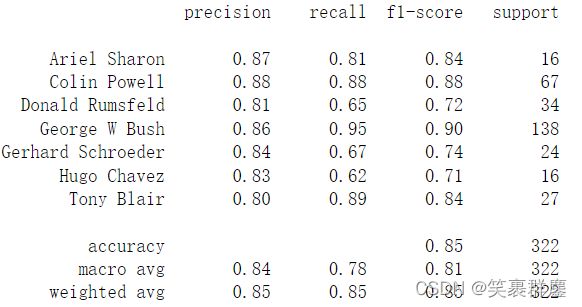
通过与6.4对比 accuracy 、 macro avg 、weighted avg值发现,网格搜索调参后人脸识别准确率也增长。
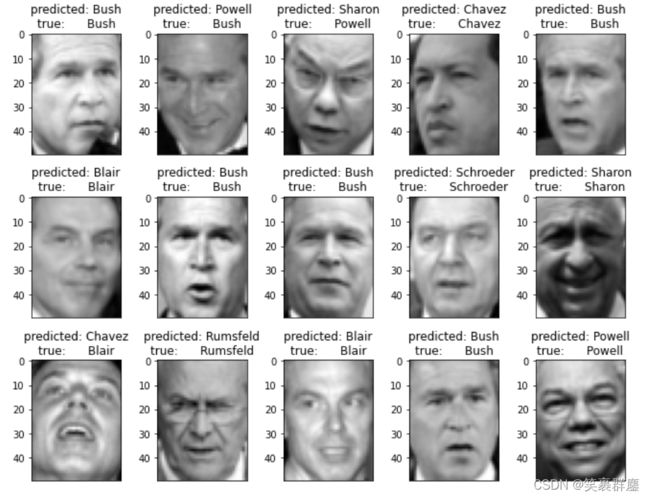
九、结果可视化
9.1画图,3行5列
def plot_gallery(images,titles,h,w,n_row = 3,n_col=5):
    plt.figure(figsize=(1.8 * n_col,2.4 * n_row))
    plt.subplots_adjust(bottom = 0,left = .01,right = .99,top = .90,hspace = .35)
    for i in range(n_row * n_col):
        plt.subplot(n_row , n_col, i + 1)
        plt.imshow(images[i].reshape((h,w)),cmap = plt.cm.gray)
        plt.title(titles[i],size = 12)
        plt.xticks(())
        plt.xticks(())
9.2 获取一张图片title
def title(predictions,y_est,target_names,i):
    pred_name = target_names[predictions[i]].split(' ')[-1]
    true_name = target_names[y_test[i]].split(' ')[-1]
    return 'predicted: %s\ntrue:      %s' % (pred_name, true_name)
9.3 获取所有图片title
prediction_tites = [title(predictions,y_test,target_names,i)\
                    for i in range(len(predictions))]
9.4 打印特征脸
plot_gallery(x_test, prediction_titles, h, w)
9.5 画图
plt.show()
完整代码
#导入必要的库
import matplotlib.pyplot as plt
from sklearn.model_selection import train_test_split
from sklearn.datasets import fetch_lfw_people
from sklearn.model_selection import GridSearchCV
from sklearn.metrics import classification_report
from sklearn.svm import SVC
from sklearn.decomposition import PCA
#载入数据
lfw_people = fetch_lfw_people(min_faces_per_person = 70,resize = 0.4)
print(lfw_people.DESCR)
plt.imshow(lfw_people.images[0],cmap = "gray")
plt.show()
#查看照片的数据格式
n_samples,h,w = lfw_people.images.shape
print(n_samples)
print(h)
print(w)
lfw_people.data.shape
target_names = lfw_people.target_names
target_names
n_classes = lfw_people.target_names.shape[0]
n_classes
#拆分训练集与测集
x_train,x_test,y_train,y_test = train_test_split(lfw_people.data,lfw_people.target)
#建立SVM分类模型
##模型实例化
model = SVC(kernel = 'rbf',class_weight = 'balanced')
##模型训练
model.fit(x_train,y_train)
##模型预测
predictions = model.predict(x_test)
##模型评价
print(classification_report(y_test,predictions,target_names=lfw_people.target_names))
#100个维度
n_components = 100
pca = PCA(n_components = n_components,whiten = True).fit(lfw_people.data)
x_train_pca = pca.transform(x_train)
x_test_pca = pca.transform(x_test)
x_train_pca.shape
model = SVC(kernel = 'rbf',class_weight = 'balanced')
model.fit(x_train_pca,y_train)
predictions = model.predict(x_test_pca)
print(classification_report(y_test,predictions,target_names = target_names))
#网格搜索
param_grid = {'C':[0.1,1,5,10,100],
              'gamma':[0.005,0.001,0.005,0.01],}
model = GridSearchCV(SVC(kernel = 'rbf',class_weight = 'balanced'),param_grid)
model.fit(x_train_pca,y_train)
print(model.best_estimator_)
predictions = model.predict(x_test_pca)
print(classification_report(y_test,predictions,target_names = target_names))
#画图,3行5列
def plot_gallery(images,titles,h,w,n_row = 3,n_col=5):
    plt.figure(figsize=(1.8 * n_col,2.4 * n_row))
    plt.subplots_adjust(bottom = 0,left = .01,right = .99,top = .90,hspace = .35)
    for i in range(n_row * n_col):
        plt.subplot(n_row , n_col, i + 1)
        plt.imshow(images[i].reshape((h,w)),cmap = plt.cm.gray)
        plt.title(titles[i],size = 12)
        plt.xticks(())
        plt.xticks(())
#获取一张图片title
def title(predictions,y_est,target_names,i):
    pred_name = target_names[predictions[i]].split(' ')[-1]
    true_name = target_names[y_test[i]].split(' ')[-1]
    return 'predicted: %s\ntrue:      %s' % (pred_name, true_name)
#获取所有图片title
prediction_tites = [title(predictions,y_test,target_names,i)\
                    for i in range(len(predictions))]
# 画图
plot_gallery(x_test, prediction_titles, h, w)
plt.show()
