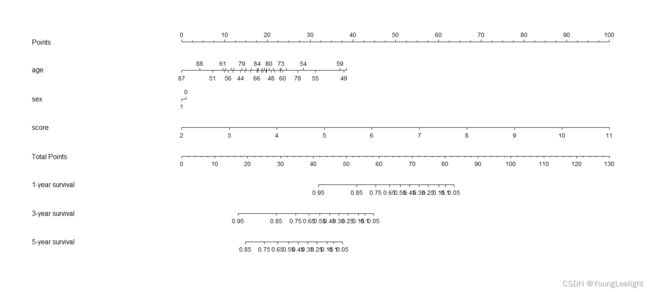
实战cox经过age和sex多因素分析 得到千个与生存相关基因cox_results然后lasso回归筛选基因得到9个基因然后计算risk_score 画roc曲线列线图森林图最优子集逐步回归
基因表达量高低分组的cox和连续变量cox回归计算的HR值差异太大? | 生信菜鸟团 (bio-info-trainee.com)
基因表达量高低分组的cox和连续变量cox回归计算的HR值差异太大? | 生信菜鸟团 (bio-info-trainee.com)
R语言| 16. 预测模型变量筛选: 代码篇 (qq.com):逐步回归 最优子集 lasso回归 step-wise
#使用min的lambda重新建模:
model_lasso_min <- glmnet(x, y, family = 'cox',
                          type.measure = 'deviance', nfolds = 10,
                          lambda = lambda.min)
head(model_lasso_1se)
head(coef(model_lasso_1se))
head(model_lasso_min)

#拎出建模使用基因:
gene_min <- rownames(model_lasso_min$beta)[as.numeric(model_lasso_min$beta)!=0]#as.numeric后"."会转化为0
gene_min #筛选出21个

 [1] "PHLDA3"    "CXCR7"     "PPP1R3B"   "CD24"      "HS3ST1"    "GPR56"     "PLEKHG2"   "CDH23"     "MRVI1"
[10] "TPST1"     "SOD3"      "PPP1R14C"  "MMP10"     "S100A14"   "IBSP"      "FAM83E"    "ACPP"      "BMP6"
[19] "GRAMD1C"   "C1orf106"  "C10orf107"
>
上述通过lasso回归之后,#使用min的lambda重新建模,得到21个基因
第二部 逐步回归法筛选最优多因素cox回归模型 逐渐回归step-wise
如何把21个基因在通过逐步回归法再缩小一下范围
如何计算多因素cox模型风险评分(Risk Score)?
1. 逐步回归法筛选最优多因素cox回归模型
https://mp.weixin.qq.com/s/lAUGZj3_R874f46dxTXKmg
#相关R包载入:
library(survival)
library(survminer)
#BiocManager::install('My.stepwise')
library(My.stepwise)

######
#表达矩阵保留筛选基因(使用TCGA训练集):
exp <- t(exprSet[gene_min,]) #转置,矩阵仅保留lasso-min筛选基因;行为样本,列为基因
View(exp)

identical(rownames(phe),rownames(exp)) #true
#将表达矩阵合并到临床信息中:
dt <- cbind(phe,exp)
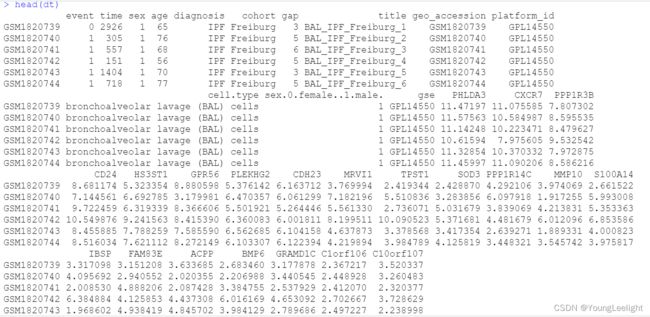
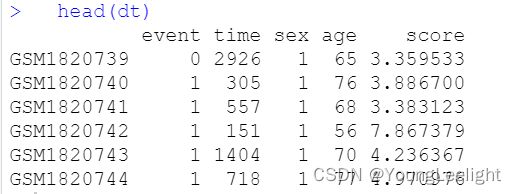
head(dt)
#逐步回归筛选(拎最后):
My.stepwise.coxph(Time = "time",
Status = "event",
variable.list = gene_min,
data = dt)
运行完上述语句之后,结果如下:
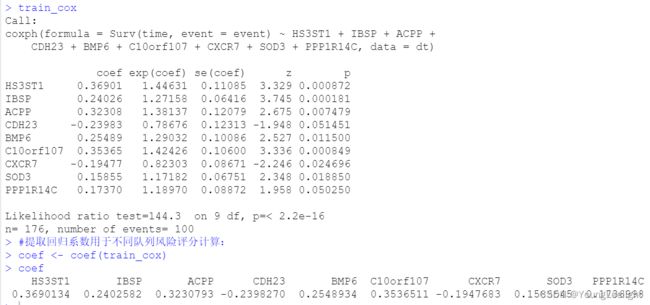
          exp(coef) exp(-coef) lower .95 upper .95
HS3ST1       1.4463     0.6914    1.1639    1.7973
IBSP         1.2716     0.7864    1.1213    1.4420
ACPP         1.3814     0.7239    1.0902    1.7504
CDH23        0.7868     1.2710    0.6181    1.0015
BMP6         1.2903     0.7750    1.0589    1.5724
C10orf107    1.4243     0.7021    1.1571    1.7531
CXCR7        0.8230     1.2150    0.6944    0.9755
SOD3         1.1718     0.8534    1.0266    1.3376
PPP1R14C     1.1897     0.8405    0.9998    1.4157

Concordance= 0.82  (se = 0.02 )
Likelihood ratio test= 144.3  on 9 df,   p=<2e-16
Wald test            = 133.2  on 9 df,   p=<2e-16
Score (logrank) test = 163.8  on 9 df,   p=<2e-16

--------------- Variance Inflating Factor (VIF) ---------------
Multicollinearity Problem: Variance Inflating Factor (VIF) is bigger than 10 (Continuous Variable) or is bigger than 2.5 (Categorical Variable)
   HS3ST1      IBSP      ACPP     CDH23      BMP6 C10orf107     CXCR7      SOD3  PPP1R14C
 1.170132  1.070454  1.223027  1.034841  1.269805  1.077068  1.047683  1.143425  1.133862
#最优cox模型筛选出的9个基因作为最终筛选结果
final_genes <- c('HS3ST1',
'IBSP', 'ACPP',
'CDH23', 'BMP6',
'C10orf107' ,
'CXCR7',
'SOD3', 'PPP1R14C')
exp <- as.data.frame(exp[,final_genes])
head(exp)
dt <- cbind(phe,exp)
#构建 最优 多(9)因素 cox比例风险 回归模型:
colnames(dt)
train_cox <- coxph(Surv(time, event = event)
                   ~ HS3ST1+IBSP+ACPP+CDH23+BMP6+C10orf107+CXCR7+SOD3+PPP1R14C,
                   data = dt)
train_cox
#提取回归系数用于不同队列风险评分计算:
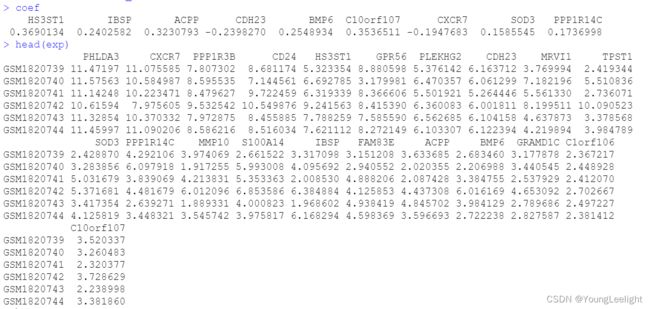
coef <- coef(train_cox)
coef
得到系数
2. 风险评分计算
#首先来看一下大部分文章中计算风险评分所采用的公式(包括本文):
#Risk score = coefficient1 * 基因1表达量 + ...+ coefficientN * 基因N表达量
######
#2.1.训练集队列风险评分计算
Input
coef
head(exp)
#Step1:先将每个基因表达量*对应系数(注意顺序,基因和对应系数不能乱):
x <- data.frame(exp$HS3ST1*coef[1],
                exp$IBSP*coef[2],
                exp$ACPP*coef[3],
                exp$CDH23*coef[4],
                exp$BMP6*coef[5],
                exp$C10orf107*coef[6],
                exp$CXCR7*coef[7],
                exp$SOD3*coef[8],
                exp$PPP1R14C*coef[9])
head(x)
colnames(x) <- names(coef)
head(x)
#Step2:将每行相加即为每个样本的风险评分:
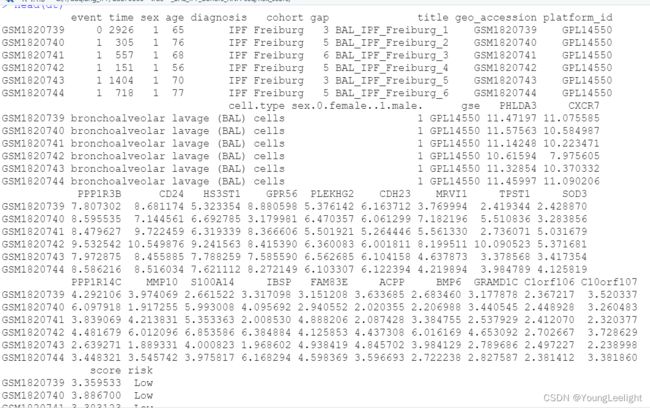
dt$score <- apply(x,1,sum) #相加,并将风险评分列添加到训练集矩阵备用
#重命名(训练集):
train <- dt
head(train)
拿到风险评分risk_score
#保存:
getwd()
file="G:/r/duqiang_IPF/GSE70866—true—_BAL_IPF_donors_RNA-seq/risk_score"
dir.create(file)
setwd(file)
getwd()
#save(coef,train,file = c('06_Risk_Score.Rdata')) #此风险评分为9个基因的风险评分
load("G:/r/duqiang_IPF/GSE70866—true—_BAL_IPF_donors_RNA-seq/risk_score/06_Risk_Score.Rdata")
#1. 风险因子联动图绘制
#1. 风险因子联动图绘制
colnames(train)

dt <- train #提取所需列:生存时间、生死、基因表达量、风险评分
dt <- dt[order(dt$score,decreasing = F),] #按风险评分从低到高排序
dt$id <- c(1:length(dt$score)) #根据调整后顺序建立编号id
head(dt)
dt$status <- ifelse(dt$event==0,'alive','death') #0/1转换为字符生死
dt$status <- factor(dt$status,levels = c("death","alive")) #指定因子调整顺序
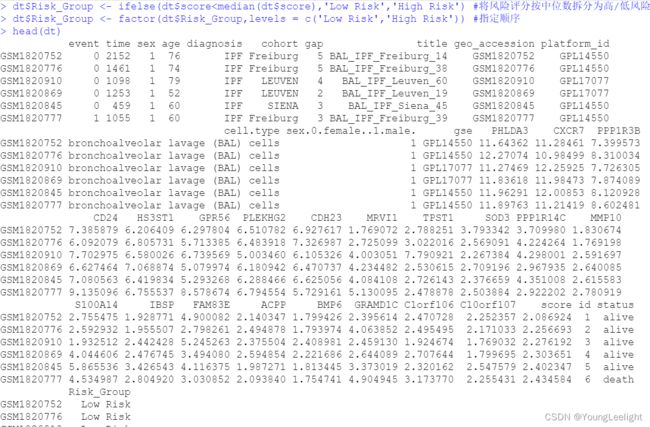
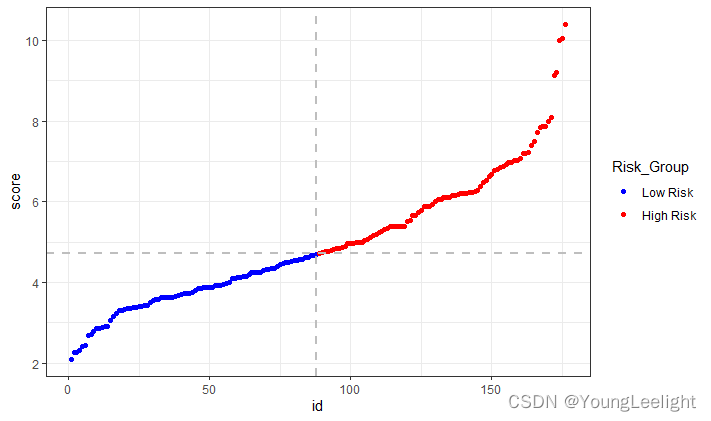
dt$Risk_Group <- ifelse(dt$score
划分好高低风险组 结果如下
重新提取表达矩阵exp
head(dt)
exp <- dt[,which(colnames(dt)=='HS3ST1'):
            which(colnames(dt)=="PPP1R14C")] %>%  #as.data.frame.matrix() %>% as.numeric() %>%
  select(everything(),'CXCR7','CDH23') #提取表达矩阵,并调整一下顺序(按风险因子和保护因子排列)
head(exp)

head(dt)
#先三个图分别绘制,最后拼接起来;
library(ggplot2)
#1.1.风险评分散点图绘制:
dev.off()
p1 <- ggplot(dt,aes(x = id,y = score)) +
geom_point(aes(col = Risk_Group)) +
scale_colour_manual(values = c("blue","red")) +
geom_hline(yintercept = median(dt$score), colour="grey", linetype="dashed", size=0.8) +
geom_vline(xintercept = sum(dt$Risk_Group == "Low Risk"), colour="grey", linetype = "dashed", size = 0.8) +
theme_bw()
p1
风险评分散点图结果如下
#1.2.患者生存时间散点图绘制:
p2 <- ggplot(dt,aes(x = id,y = time)) +
  geom_point(aes(col = status)) +
  scale_colour_manual(values = c("red","blue")) +
  geom_vline(xintercept = sum(dt$Risk_Group == "Low Risk"), colour = "grey", linetype = "dashed", size = 0.8) +
  theme_bw()
p2


#1.3.表达量热图绘制:
mycol <- colorRampPalette(c("blue","yellow","red"))(100) #自定义颜色
exp2 <- t(scale(exp)) #矩阵标准化:
exp2[1:5,1:4]


#添加分组信息:
head(dt)
annotation <- data.frame(Type = as.vector(dt[,ncol(dt)]))
head(annotation)
rownames(annotation) <- colnames(exp2)
annotation$Type <- factor(annotation$Type,levels = c('Low Risk','High Risk'))
head(annotation)


ann_colors <- list(Type = c('Low Risk' = "blue",
                            'High Risk' = "red")) #添加分组颜色信息
#绘图:
library(pheatmap)
pheatmap(exp2,
         col= mycol,
         cluster_rows = F,
         cluster_cols = F,
         show_colnames = F,
         annotation_col = annotation,
         annotation_colors = ann_colors,
         annotation_legend = F
)


#将热图转化为ggplot2对象:
library(ggpubr)
library(ggplotify )
p3 <- as.ggplot(as.grob(pheatmap(exp2,
                                 col= mycol,
                                 cluster_rows = F,
                                 cluster_cols = F,
                                 show_colnames = F,
                                 annotation_col = annotation,
                                 annotation_colors = ann_colors,
                                 annotation_legend = F
)))
#拼图:
library(cowplot)
plot_grid(p1,p2,p3, nrow = 3, align = "v", axis = "tlbr") #可以看到直接拼在一起热图是对不齐的
2. 生存分析绘制 高低风险组生存分析
#save(coef,train,file = c('06_Risk_Score.Rdata'))
load("G:/r/duqiang_IPF/GSE70866—true—_BAL_IPF_donors_RNA-seq/risk_score/06_Risk_Score.Rdata")


#相关R包载入:
library(survminer)
library(survival)
#重新载入数据:
rm(list = ls()) #先清空工作环境

dt <- train #TCGA训练集
head(dt)
dt$risk <- ifelse(dt$score > median(dt$score),"High","Low") #将风险评分按中位数拆分为高/低风险两组
#2.生存分析绘制:
fit <- survfit(Surv(time, event) ~ risk, data = dt)
fit

ggsurvplot(
  fit,
  data = dt,
  censor = T, #是否绘制删失点
  censor.shape = "|", censor.size = 4,
  conf.int = TRUE, #是否显示置信区间
  conf.int.style = "ribbon",
  conf.int.alpha = 0.3,
  pval = TRUE, #是否显示P值
  pval.size = 5,
  legend = "top", #图例位置
  legend.title = 'Risk Score',
  legend.labs = c("High Risk","Low Risk"),
  xlab = "Days",
  ylab = "Survival probablity",
  title = "Discovery TCGA Cohort",
  palette = c('#ed0000','#00468b'), #调用色板or自行创建
  ggtheme = theme_bw(), #主题修改
  risk.table = TRUE, #是否风险表添加
  risk.table.col = "strata", #颜色跟随曲线
  risk.table.title = 'Number at risk',
  fontsize = 4,
  risk.table.y.text = FALSE, #是否显示风险表y轴标签
  risk.table.height = 0.2,
)
input
结果如下
一、独立预后指标筛选:多因素+单因素cox
input
##
#save(coef,train,file = c('06_Risk_Score.Rdata'))
load("G:/r/duqiang_IPF/GSE70866—true—_BAL_IPF_donors_RNA-seq/risk_score/06_Risk_Score.Rdata")

dt <- train #TCGA总队列

#1.1 数据清洗
#修改列名:
#colnames(dt) <- c("submitter_id","status","OS","Age","Gender","Clinical_stage","T_stage","M_stage","N_stage","PHKG1","PLAUR","NDRG1","GAPDH","KIF5A","Risk_score")
head(dt)


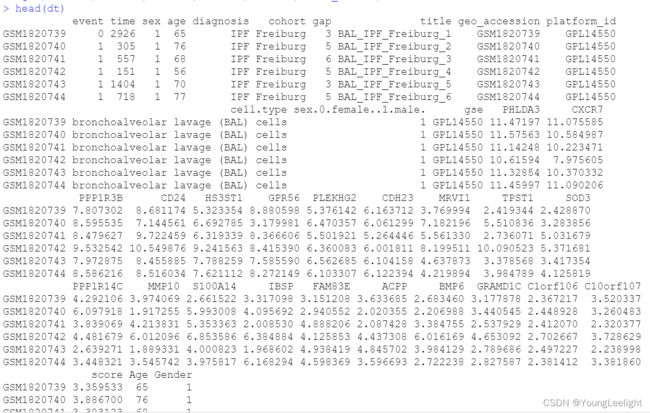
#将所有需要观测的变量转换为数值型:
#年龄转换:
dt$Age <- as.numeric(dt$age)

#性别转换:
table(dt$sex) #转换前
dt$Gender <- ifelse(dt$sex =='0',0,1)
table(dt$Gender) #转换后
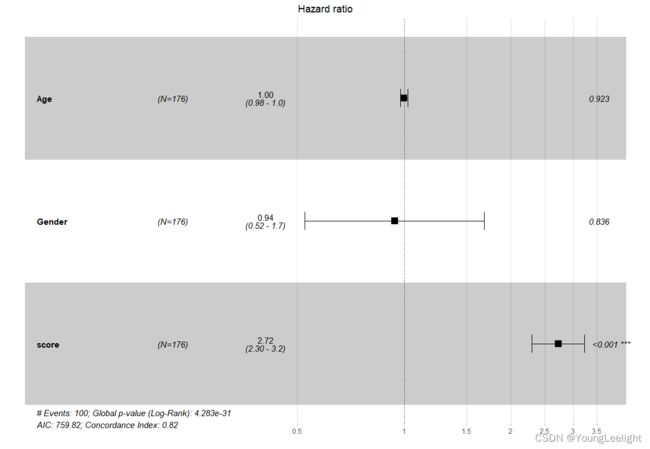
下面我们通过结合单因素与多因素cox,筛选出独立预后指标。
#1.2 多因素/单因素cox建模与风险森林图绘制
#多因素cox回归模型构建:
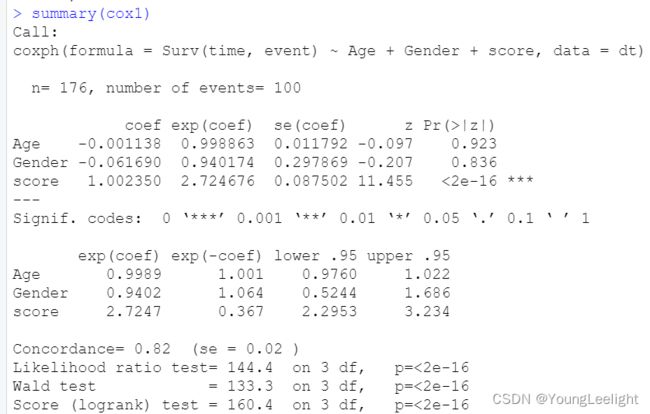
cox1 <- coxph(Surv(time, event) ~ Age +Gender+ score, data = dt)
cox1
summary(cox1)
性别和年龄再coxph多因素分析中不显著,删掉
#风险森林图可视化多因素cox:
options(scipen=1)
ggforest(cox1,
         data = dt,
         main = "Hazard ratio", #标题
         cpositions = c(0.02, 0.22, 0.4), #前三列距离
         fontsize = 1, #字体相对大小
         refLabel = "1", #相对变量的数值标签
         noDigits = 2) #95%CI、p值、HR值等保留小数点后位数
森林图 结果
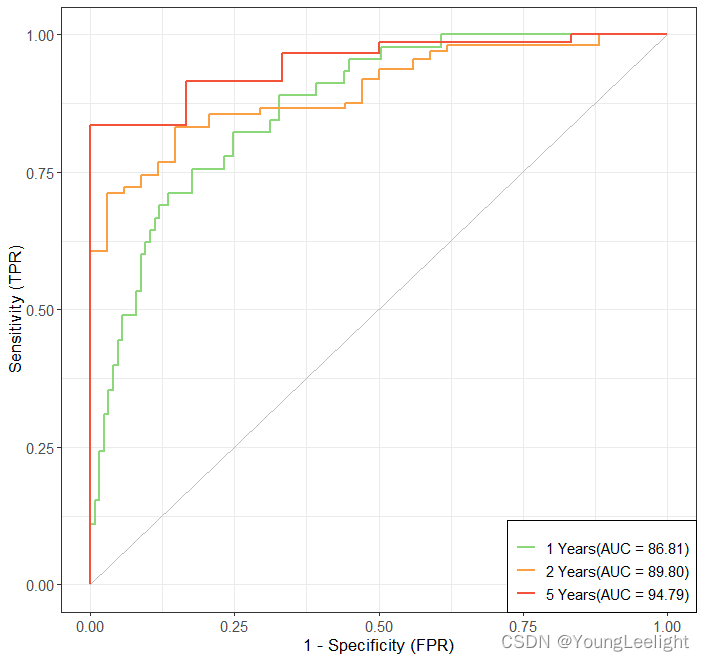
二、timeROC验证预后模型(风险评分)准确度
input输入
#save(coef,train,file = c('06_Risk_Score.Rdata'))
load("G:/r/duqiang_IPF/GSE70866—true—_BAL_IPF_donors_RNA-seq/risk_score/06_Risk_Score.Rdata")
head(train)

if(1==1){
  #提取目标列:
  dt <- train[,c(1:4,ncol(train))]
  head(dt)

  #时间依赖性ROC曲线绘制:
  boxplot(dt$time)
  timeROC <- with(dt, #with限制数据框;
                  timeROC(T = time,
                          delta = event,
                          marker = score, #预测的生死(默认较大的预测值和高事件风险相关,如果较大预测值和低风险事件相关,需要添加一个“-”反转关联)
                          cause = 1, #阳性事件结局(这里阳性事件为死亡,对应1)
                          times = c(365,3*365,5*365), #时间点划分:c(1,3,5)1年、3年、5年
                          ROC = TRUE, #是否保存TP和FP值
                          iid = TRUE, #是否计算ROC曲线下面积
                          weighting = "marginal")) #权重计算方法,默认
  print(timeROC)

  #使用ggplot2绘图:
  #提取各生存时间点的TPR、FPR值:
  df <- data.frame(FPR = as.numeric(timeROC$FP),
                   TPR = as.numeric(timeROC$TP),
                   time = rep(as.factor(c(1,3,5)), each = nrow(timeROC$TP)))
  head(df)
  #自定义主题:
  mytheme <- theme(axis.title = element_text(size = 13),
                   axis.text = element_text(size = 11),
                   plot.title = element_text(size = 14,
                                             hjust = 0.5,
                                             face = "bold"),
                   legend.title = element_text(size = 13),
                   legend.text = element_text(size = 11),
                   legend.background = element_rect(linetype = 1, size = 0.25, colour = "black"),
                   legend.position = c(1, 0),
                   legend.justification = c(1, 0))

  #timeROC绘制:
  p <- ggplot() +
    geom_line(data = df,aes(x = FPR, y = TPR, color = time), size = 1) +
    geom_line(aes(x = c(0,1),y = c(0,1)),color = "grey") +
    scale_color_manual(name = NULL, values = c("#8AD879","#FA9F42", "#F3533A"),
                       labels = c("1 Years(AUC = 86.81)" ,
                                  "2 Years(AUC = 89.80)",
                                  "5 Years(AUC = 94.79)"))+
    theme_bw() +
    mytheme +
    labs(x = "1 - Specificity (FPR)",
         y = "Sensitivity (TPR)")
  p


}
结果如下
print(timeROC)
Time-dependent-Roc curve estimated using IPCW  (n=176, without competing risks).
       Cases Survivors Censored AUC (%)   se
t=365     45       125        6   86.81 2.87
t=1095    89        34       53   89.80 2.97
t=1825   100         6       70   94.79 2.90

Method used for estimating IPCW:marginal

Total computation time : 0.03  secs.
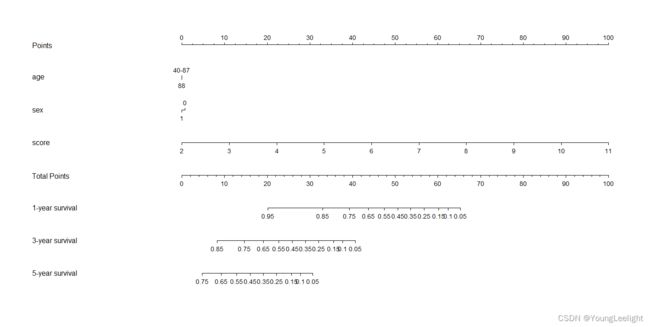
三、列线图/诺莫图模型建立 cox结果可视化森林图
input
https://mp.weixin.qq.com/s/rJUjp5fLh9Z8GYcTaJrgkA
#save(coef,train,file = c('06_Risk_Score.Rdata'))
load("G:/r/duqiang_IPF/GSE70866—true—_BAL_IPF_donors_RNA-seq/risk_score/06_Risk_Score.Rdata")
head(train)
dt=train
head(dt)

class(dt$age)
dt$age=as.numeric(dt$age) ##数据类型很重要 否则结果就不对

library(timeROC)
library(ggplot2)
library(rms)
#打包数据:
dd <- datadist(dt)
options(datadist = "dd")

#多因素cox模型构建:
f <- cph(Surv(time, event) ~ age + sex + score, data = dt,
         x = T,y = T,surv = T)
f
#列线图构建:
surv <- Survival(f)#预测生存概率
surv1 <- function(x) surv(1*365,x) #一年生存概率预测
surv3 <- function(x) surv(3*365,x) #三年生存概率预测
surv5 <- function(x) surv(5*365,x) #五年生存概率预测
nom <- nomogram(f,
                fun = list(surv1,surv3,surv5),
                lp = F,
                funlabel = c("1-year survival","3-year survival","5-year survival"),
                fun.at = c(0.1,seq(0.05,1,by = 0.1),1))#生存概率坐标轴步长和范围
plot(nom)
结果如下
