Kaggle实战:Pytorch实现房价预测
Kaggle实战:Pytorch实现房价预测
近来,我一直在学习pytorch与深度学习的理论知识,但一直苦于无法深入地理解某些理论及其背后的意义,并且很难从0开始用pytorch搭建一深度学习网络来解决一个实际问题。直到偶然接触了《动手学深度学习》这本书,我感觉收获颇丰。
这本书其中一章节是讲实战Kaggle比赛:预测房价,其中涵盖非常丰富的知识,为此我将整个实现过程记录如下,不足之处还请大家批评指正。
一、问题背景
Ask a home buyer to describe their dream house, and they probably won’t begin with the height of the basement ceiling or the proximity to an east-west railroad. But this playground competition’s dataset proves that much more influences price negotiations than the number of bedrooms or a white-picket fence.
With 79 explanatory variables describing (almost) every aspect of residential homes in Ames, Iowa, this competition challenges you to predict the final price of each home.
Kaggle网址:https://www.kaggle.com/competitions/house-prices-advanced-regression-techniques
数据集下载:
链接:https://pan.baidu.com/s/126T6iPUDNRAU-pO8KJyOaA
提取码:11oc
二、数据处理
2.1 导入包
import numpy as np
import pandas as pd
import torch
from torch import nn
from d2l import torch as d2l
import seaborn as sns
from matplotlib import pyplot as plt
from scipy.stats import norm, skew
2.2 读取CSV文件
train_data = pd.read_csv("train.csv")  # [1460 rows x 81 columns]
test_data = pd.read_csv("test.csv")  # [1459 rows x 80 columns]
train_data.head()
   Id  MSSubClass MSZoning  ...  SaleType  SaleCondition SalePrice
0   1          60       RL  ...        WD         Normal    208500
1   2          20       RL  ...        WD         Normal    181500
2   3          60       RL  ...        WD         Normal    223500
3   4          70       RL  ...        WD        Abnorml    140000
4   5          60       RL  ...        WD         Normal    250000
train_data.info()
<class 'pandas.core.frame.DataFrame'>
RangeIndex: 1460 entries, 0 to 1459
Data columns (total 81 columns):
 #   Column         Non-Null Count  Dtype
---  ------         --------------  -----
 0   Id             1460 non-null   int64
 1   MSSubClass     1460 non-null   int64
 2   MSZoning       1460 non-null   object
 3   LotFrontage    1201 non-null   float64
 4   LotArea        1460 non-null   int64
 5   Street         1460 non-null   object
 6   Alley          91 non-null     object
 7   LotShape       1460 non-null   object
 8   LandContour    1460 non-null   object
 9   Utilities      1460 non-null   object
 10  LotConfig      1460 non-null   object
 11  LandSlope      1460 non-null   object
 12  Neighborhood   1460 non-null   object
 13  Condition1     1460 non-null   object
 14  Condition2     1460 non-null   object
 15  BldgType       1460 non-null   object
 16  HouseStyle     1460 non-null   object
 17  OverallQual    1460 non-null   int64
 18  OverallCond    1460 non-null   int64
 19  YearBuilt      1460 non-null   int64
 20  YearRemodAdd   1460 non-null   int64
 21  RoofStyle      1460 non-null   object
 22  RoofMatl       1460 non-null   object
 23  Exterior1st    1460 non-null   object
 24  Exterior2nd    1460 non-null   object
 25  MasVnrType     1452 non-null   object
 26  MasVnrArea     1452 non-null   float64
 27  ExterQual      1460 non-null   object
 28  ExterCond      1460 non-null   object
 29  Foundation     1460 non-null   object
 30  BsmtQual       1423 non-null   object
 31  BsmtCond       1423 non-null   object
 32  BsmtExposure   1422 non-null   object
 33  BsmtFinType1   1423 non-null   object
 34  BsmtFinSF1     1460 non-null   int64
 35  BsmtFinType2   1422 non-null   object
 36  BsmtFinSF2     1460 non-null   int64
 37  BsmtUnfSF      1460 non-null   int64
 38  TotalBsmtSF    1460 non-null   int64
 39  Heating        1460 non-null   object
 40  HeatingQC      1460 non-null   object
 41  CentralAir     1460 non-null   object
 42  Electrical     1459 non-null   object
 43  1stFlrSF       1460 non-null   int64
 44  2ndFlrSF       1460 non-null   int64
 45  LowQualFinSF   1460 non-null   int64
 46  GrLivArea      1460 non-null   int64
 47  BsmtFullBath   1460 non-null   int64
 48  BsmtHalfBath   1460 non-null   int64
 49  FullBath       1460 non-null   int64
 50  HalfBath       1460 non-null   int64
 51  BedroomAbvGr   1460 non-null   int64
 52  KitchenAbvGr   1460 non-null   int64
 53  KitchenQual    1460 non-null   object
 54  TotRmsAbvGrd   1460 non-null   int64
 55  Functional     1460 non-null   object
 56  Fireplaces     1460 non-null   int64
 57  FireplaceQu    770 non-null    object
 58  GarageType     1379 non-null   object
 59  GarageYrBlt    1379 non-null   float64
 60  GarageFinish   1379 non-null   object
 61  GarageCars     1460 non-null   int64
 62  GarageArea     1460 non-null   int64
 63  GarageQual     1379 non-null   object
 64  GarageCond     1379 non-null   object
 65  PavedDrive     1460 non-null   object
 66  WoodDeckSF     1460 non-null   int64
 67  OpenPorchSF    1460 non-null   int64
 68  EnclosedPorch  1460 non-null   int64
 69  3SsnPorch      1460 non-null   int64
 70  ScreenPorch    1460 non-null   int64
 71  PoolArea       1460 non-null   int64
 72  PoolQC         7 non-null      object
 73  Fence          281 non-null    object
 74  MiscFeature    54 non-null     object
 75  MiscVal        1460 non-null   int64
 76  MoSold         1460 non-null   int64
 77  YrSold         1460 non-null   int64
 78  SaleType       1460 non-null   object
 79  SaleCondition  1460 non-null   object
 80  SalePrice      1460 non-null   int64
dtypes: float64(3), int64(35), object(43)
memory usage: 924.0+ KB
None
2.3 数据分析
分析房价
我们的目标列是房价‘SalePrice’,因此我们先对其进行分析
train_data[‘SalePrice’].describe()
count      1460.000000
mean     180921.195890
std       79442.502883
min       34900.000000
25%      129975.000000
50%      163000.000000
75%      214000.000000
max      755000.000000
Name: SalePrice, dtype: float64
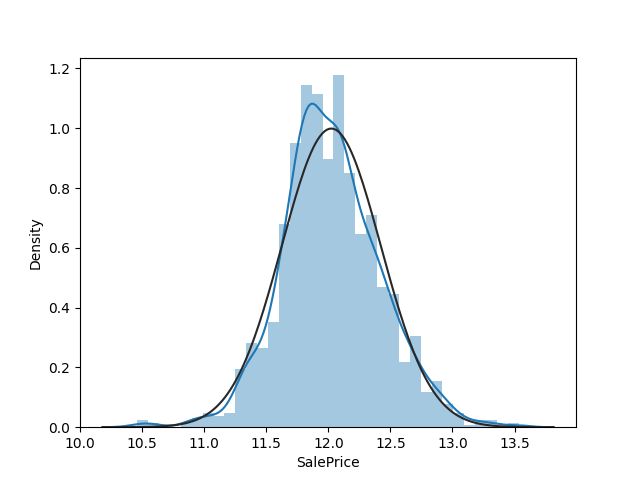
sns.distplot(train_data[‘SalePrice’])
由上图可知,SalePrice呈现正的偏度,我们需对其进行修正
print("Skewness: %f" % train_data['SalePrice'].skew())
print("Kurtosis: %f" % train_data['SalePrice'].kurt())
Skewness: 1.882876
Kurtosis: 6.536282
train_data['SalePrice'] = np.log1p(train_data['SalePrice'])
sns.distplot(train_data['SalePrice'], fit=norm)
研究部分因素对房价的影响
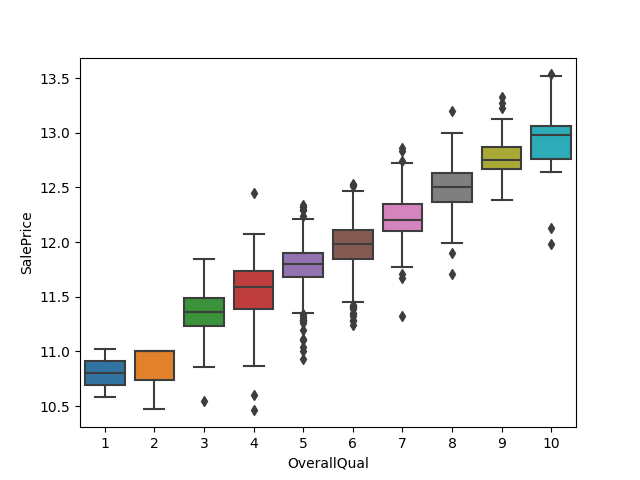
sns.boxplot(data=train_data, x=‘OverallQual’, y=‘SalePrice’)
plt.figure(figsize=(12,4),dpi=130)
sns.boxplot(data=train_data, x='YearBuilt', y='SalePrice')
plt.xticks(rotation=90)
plt.show()
sns.scatterplot(data=train,x=‘TotalBsmtSF’,y=‘SalePrice’)
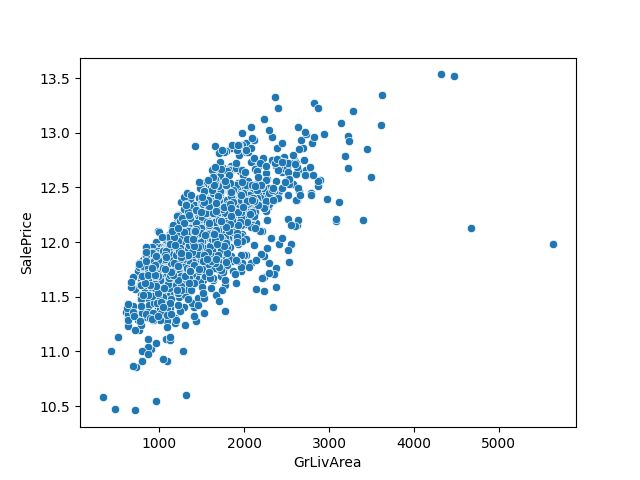
sns.scatterplot(data=train_data, x=‘GrLivArea’, y=‘SalePrice’)
相关性分析
print(train_data.corr()[“SalePrice”].sort_values(ascending=False)[1:])
OverallQual      0.817185
GrLivArea        0.700927
GarageCars       0.680625
GarageArea       0.650888
TotalBsmtSF      0.612134
1stFlrSF         0.596981
FullBath         0.594771
YearBuilt        0.586570
YearRemodAdd     0.565608
GarageYrBlt      0.541073
TotRmsAbvGrd     0.534422
Fireplaces       0.489450
MasVnrArea       0.430809
BsmtFinSF1       0.372023
LotFrontage      0.355879
WoodDeckSF       0.334135
OpenPorchSF      0.321053
2ndFlrSF         0.319300
HalfBath         0.313982
LotArea          0.257320
BsmtFullBath     0.236224
BsmtUnfSF        0.221985
BedroomAbvGr     0.209043
ScreenPorch      0.121208
PoolArea         0.069798
MoSold           0.057330
3SsnPorch        0.054900
BsmtFinSF2       0.004832
BsmtHalfBath    -0.005149
Id              -0.017942
MiscVal         -0.020021
OverallCond     -0.036868
YrSold          -0.037263
LowQualFinSF    -0.037963
MSSubClass      -0.073959
KitchenAbvGr    -0.147548
EnclosedPorch   -0.149050
Name: SalePrice, dtype: float64
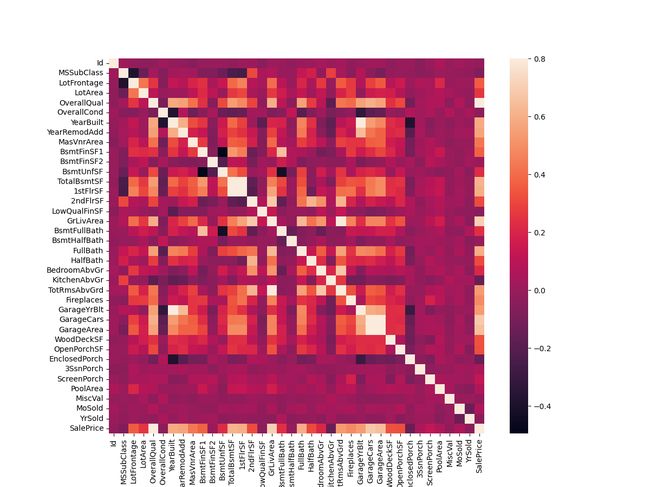
corrmat = train_data.corr()
f, ax = plt.subplots(figsize=(12, 9))
sns.heatmap(corrmat, vmax=.8, square=True)
plt.show()
corr = train_data.corr()
highest_corr_features = corr.index[abs(corr["SalePrice"])>0.5]
plt.figure(figsize=(10, 10))
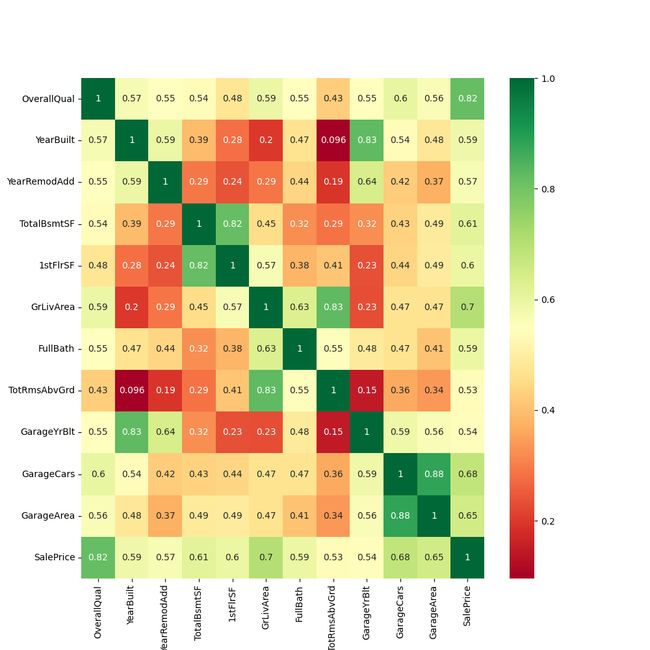
g = sns.heatmap(train_data[highest_corr_features].corr(), annot=True, cmap="RdYlGn")
plt.show()
从以上两张热力图,我们可得知:
- ‘OverQual’ in the top of highest correlation it’s 0.79!
- ‘GarageCars’ & ‘GarageArea’ like each other (correlation between them is 0.88)
- ‘TotalBsmtSF’ & ‘1stFlrSF’ also like each other (correlation betwwen them is 0.82), so we can keep either one of them or add the1stFlrSF to the Toltal.
- ‘TotRmsAbvGrd’ & ‘GrLivArea’ also has a strong correlation (0.83), I decided to keep ‘GrLivArea’ because it’s correlation with ‘SalePrice’ is higher.
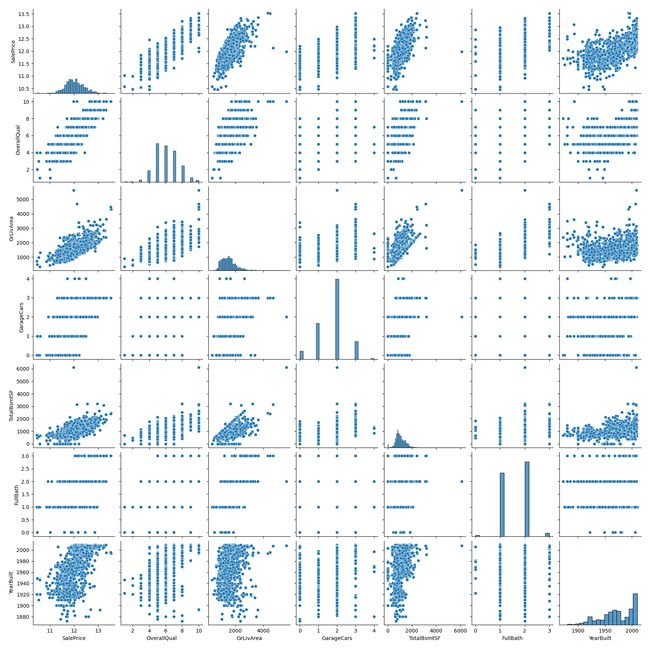
接下来我们分析与房价相关性高的特征
cols = ['SalePrice', 'OverallQual', 'GrLivArea', 'GarageCars', 'TotalBsmtSF', 'FullBath', 'YearBuilt']
sns.pairplot(train_data[cols])
plt.show()
2.4 处理缺失数据
y_train = train_data['SalePrice']
test_id = test_data['Id']
all_data = pd.concat([train_data, test_data], axis=0, sort=False)
all_data = all_data.drop(['Id', 'SalePrice'], axis=1)
Total = all_data.isnull().sum().sort_values(ascending=False)
percent = (all_data.isnull().sum() / all_data.isnull().count() * 100).sort_values(ascending=False)
missing_data = pd.concat([Total, percent], axis=1, keys=['Total', 'Percent'])
print(missing_data.head(25))
              Total    Percent
PoolQC         2909  99.657417
MiscFeature    2814  96.402878
Alley          2721  93.216855
Fence          2348  80.438506
FireplaceQu    1420  48.646797
LotFrontage     486  16.649538
GarageYrBlt     159   5.447071
GarageFinish    159   5.447071
GarageQual      159   5.447071
GarageCond      159   5.447071
GarageType      157   5.378554
BsmtExposure     82   2.809181
BsmtCond         82   2.809181
BsmtQual         81   2.774923
BsmtFinType2     80   2.740665
BsmtFinType1     79   2.706406
MasVnrType       24   0.822199
MasVnrArea       23   0.787941
MSZoning          4   0.137033
Functional        2   0.068517
BsmtHalfBath      2   0.068517
BsmtFullBath      2   0.068517
Utilities         2   0.068517
SaleType          1   0.034258
BsmtFinSF1        1   0.034258
由上述结果我们发现,数据缺失率高的特征同时也是不重要的特征(correlation < 0.5),因此删除这些特征所在的列不会影响模型的预测。
all_data.drop((missing_data[missing_data['Total'] > 5]).index, axis=1, inplace=True)
print(all_data.isnull().sum().max())
4
查看剩余的包含缺失数据的特征
total = all_data.isnull().sum().sort_values(ascending=False)
total.head(19)
MSZoning        4
Functional      2
BsmtFullBath    2
BsmtHalfBath    2
Utilities       2
BsmtFinSF2      1
Exterior2nd     1
GarageCars      1
GarageArea      1
BsmtFinSF1      1
BsmtUnfSF       1
Exterior1st     1
TotalBsmtSF     1
Electrical      1
SaleType        1
KitchenQual     1
HalfBath        0
FullBath        0
BedroomAbvGr    0
dtype: int64
填充缺失数据
填充numeric型数据
numeric_missed = ['BsmtFinSF1',
                  'BsmtFinSF2',
                  'BsmtUnfSF',
                  'TotalBsmtSF',
                  'BsmtFullBath',
                  'BsmtHalfBath',
                  'GarageArea',
                  'GarageCars']

for feature in numeric_missed:
    all_data[feature] = all_data[feature].fillna(0)
填充categorical型数据
categorical_missed = ['Exterior1st',
                      'Exterior2nd',
                      'SaleType',
                      'MSZoning',
                      'Electrical',
                      'KitchenQual']

for feature in categorical_missed:
    all_data[feature] = all_data[feature].fillna(all_data[feature].mode()[0])
# Fill in the remaining missing values with the values that are most common for this feature.
all_data['Functional'] = all_data['Functional'].fillna('Typ')
查看是否还有缺失值
print(all_data.isnull().sum().max())
0
2.5 修正特征偏度
查看特征偏度
numeric_feats = all_data.dtypes[all_data.dtypes != 'object'].index
skewed_feats = all_data[numeric_feats].apply(lambda x: skew(x)).sort_values(ascending=False)
high_skew = skewed_feats[abs(skewed_feats) > 0.5]
print(high_skew)
MiscVal          21.947195
PoolArea         16.898328
LotArea          12.822431
LowQualFinSF     12.088761
3SsnPorch        11.376065
KitchenAbvGr      4.302254
BsmtFinSF2        4.146143
EnclosedPorch     4.003891
ScreenPorch       3.946694
BsmtHalfBath      3.931594
OpenPorchSF       2.535114
WoodDeckSF        1.842433
1stFlrSF          1.469604
BsmtFinSF1        1.425230
MSSubClass        1.375457
GrLivArea         1.269358
TotalBsmtSF       1.156894
BsmtUnfSF         0.919339
2ndFlrSF          0.861675
TotRmsAbvGrd      0.758367
Fireplaces        0.733495
HalfBath          0.694566
BsmtFullBath      0.624832
OverallCond       0.570312
YearBuilt        -0.599806
dtype: float64
修正偏度
for feature in high_skew.index:
    all_data[feature] = np.log1p(all_data[feature])
添加一个新特征
all_data['TotalSF'] = all_data['TotalBsmtSF'] + all_data['1stFlrSF'] + all_data['2ndFlrSF']
2.6 将类别型特征独热编码
all_data = pd.get_dummies(all_data)
all_data.head()
   MSSubClass   LotArea  ...  SaleCondition_Normal  SaleCondition_Partial
0    4.110874  9.042040  ...                     1                      0
1    3.044522  9.169623  ...                     1                      0
2    4.110874  9.328212  ...                     1                      0
3    4.262680  9.164401  ...                     0                      0
4    4.110874  9.565284  ...                     1                      0
最后得到的训练集和测试集:
x_train = all_data[:len(y_train)]  # (1460, 219)
x_test = all_data[len(y_train):]  # (1459, 219)
转为tensor:
train_features = torch.tensor(x_train.values, dtype=torch.float32)  # torch.Size([1460, 219])
test_features = torch.tensor(x_test.values, dtype=torch.float32)  # torch.Size([1459, 219])

train_labels = torch.tensor(
    train_data.SalePrice.values.reshape(-1, 1), dtype=torch.float32)  # torch.Size([1460, 1])
三、模型建立
3.1 定义网络模型
首先,我们训练一个带有损失平方的线性模型。 显然线性模型很难让我们在竞赛中获胜,但线性模型提供了一种健全性检查, 以查看数据中是否存在有意义的信息。 如果我们在这里不能做得比随机猜测更好,那么我们很可能存在数据处理错误。 如果一切顺利,线性模型将作为基线(baseline)模型, 让我们直观地知道最好的模型有超出简单的模型多少。
loss = nn.MSELoss()
in_features = train_features.shape[1]

def get_net():
    net = nn.Sequential(nn.Linear(in_features, 1))
    # 模型参数初始化
    for param in net.parameters():
        nn.init.normal_(param, mean=0, std=0.01)
    return net
3.2 定义训练函数
我们的训练函数将借助Adam优化器 ,Adam优化器的主要吸引力在于它对初始学习率不那么敏感。
def train(net, train_features, train_labels, test_features, test_labels,
          num_epochs, learning_rate, weight_decay, batch_size):
    train_ls, test_ls = [], []
    train_iter = d2l.load_array((train_features, train_labels), batch_size)
    # 这里使用的是Adam优化算法
    optimizer = torch.optim.Adam(net.parameters(),
                                 lr=learning_rate,
                                 weight_decay=weight_decay)
    for epoch in range(num_epochs):
        for X, y in train_iter:
            optimizer.zero_grad()
            l = loss(net(X), y)
            l.backward()
            optimizer.step()
        train_ls.append(loss(net(train_features), train_labels).item())
        if test_labels is not None:
            test_ls.append(loss(net(test_features), test_labels).item())
    return train_ls, test_ls
四、K折交叉验证
K折交叉验证有助于模型选择和超参数调整。 我们首先需要定义一个函数,在K折交叉验证过程中返回第i折的数据。 具体地说,它选择第i个切片作为验证数据,其余部分作为训练数据。 注意,这并不是处理数据的最有效方法,如果我们的数据集大得多,会有其他解决办法。
def get_k_fold_data(k, i, X, y):
    assert k > 1
    fold_size = X.shape[0] // k
    X_train, y_train = None, None
    for j in range(k):
        idx = slice(j * fold_size, (j + 1) * fold_size)
        X_part, y_part = X[idx, :], y[idx]
        if j == i:
            X_valid, y_valid = X_part, y_part
        elif X_train is None:
            X_train, y_train = X_part, y_part
        else:
            X_train = torch.cat([X_train, X_part], 0)
            y_train = torch.cat([y_train, y_part], 0)
    return X_train, y_train, X_valid, y_valid
当我们在K折交叉验证中训练K次后,返回训练和验证误差的平均值。
def k_fold(k, X_train, y_train, num_epochs, learning_rate, weight_decay,
           batch_size):
    train_l_sum, valid_l_sum = 0, 0
    for i in range(k):
        data = get_k_fold_data(k, i, X_train, y_train)
        net = get_net()
        train_ls, valid_ls = train(net, *data, num_epochs, learning_rate,
                                   weight_decay, batch_size)
        train_l_sum += train_ls[-1]
        valid_l_sum += valid_ls[-1]
        if i == 0:
            d2l.plot(list(range(1, num_epochs + 1)), [train_ls, valid_ls],
                     xlabel='epoch', ylabel='rmse', xlim=[1, num_epochs],
                     legend=['train', 'valid'], yscale='log')
        print(f'折{i + 1},训练log rmse{float(train_ls[-1]):f}, '
              f'验证log rmse{float(valid_ls[-1]):f}')
    return train_l_sum / k, valid_l_sum / k
五、模型选择
找到一组调优的超参数可能需要时间,这取决于我们优化了多少变量。 有了足够大的数据集和合理设置的超参数,K折交叉验证往往对多次测试具有相当的稳定性。 然而,如果我们尝试了不合理的超参数,我们可能会发现验证效果不再代表真正的误差。
k, num_epochs, lr, weight_decay, batch_size = 5, 200, 0.0002, 0, 64
train_l, valid_l = k_fold(k, train_features, train_labels, num_epochs, lr,
                          weight_decay, batch_size)
print(f'{k}-折验证: 平均训练log rmse: {float(train_l):f}, '
      f'平均验证log rmse: {float(valid_l):f}')
d2l.plt.show()
折1,训练log rmse0.010107, 验证log rmse0.015819
折2,训练log rmse0.008903, 验证log rmse0.022045
折3,训练log rmse0.008702, 验证log rmse0.019592
折4,训练log rmse0.009519, 验证log rmse0.014886
折5,训练log rmse0.009213, 验证log rmse0.026204
5-折验证: 平均训练log rmse: 0.009289, 平均验证log rmse: 0.019709
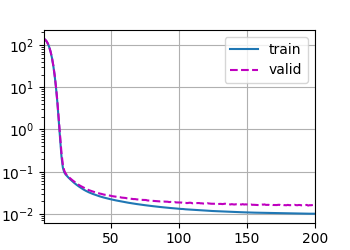
请注意,有时一组超参数的训练误差可能非常低,但折交叉验证的误差要高得多, 这表明模型过拟合了。 在整个训练过程中,你将希望监控训练误差和验证误差这两个数字。 较少的过拟合可能表明现有数据可以支撑一个更强大的模型, 较大的过拟合可能意味着我们可以通过正则化技术来获益。
六、房价预测
当我们知道应该选择什么样的超参数, 我们不妨使用所有数据对其进行训练 (而不是仅使用交叉验证中使用的的数据)。 然后,我们通过这种方式获得的模型可以应用于测试集。 将预测保存在CSV文件中可以简化将结果上传到Kaggle的过程。
def train_and_pred(train_features, test_features, train_labels, test_data,
                   num_epochs, lr, weight_decay, batch_size):
    net = get_net()
    train_ls, _ = train(net, train_features, train_labels, None, None,
                        num_epochs, lr, weight_decay, batch_size)
    d2l.plot(np.arange(1, num_epochs + 1), [train_ls], xlabel='epoch',
             ylabel='log rmse', xlim=[1, num_epochs], yscale='log')
    print(f'训练log rmse:{float(train_ls[-1]):f}')
    # 将网络应用于测试集。
    preds = net(test_features).detach().numpy()
    preds = numpy.exp(preds) - 1
    # 将其重新格式化以导出到Kaggle
    test_data['SalePrice'] = pd.Series(preds.reshape(1, -1)[0])
    submission = pd.concat([test_data['Id'], test_data['SalePrice']], axis=1)
    submission.to_csv('submission.csv', index=False)
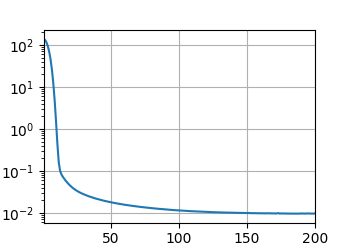
如果测试集上的预测与K倍交叉验证过程中的预测相似, 那就是时候把它们上传到Kaggle了。 下面的代码将生成一个名为submission.csv的文件。
train_and_pred(train_features, test_features, train_labels, test_data,
               num_epochs, lr, weight_decay, batch_size)
d2l.plt.show()
训练log rmse:0.009800
将submission.csv文件提交到Kaggle网址,得到最终的分数与排名

博主目前还是一位AI领域的小白,预测的效果不是很好,大佬勿喷
代码已上传至github:https://github.com/Ming7959/Kaggle

