卷积神经网络——LeNet-5网络及python实现
简介:
卷积神经网络(CNN)在图像处理方面有着得天独厚的优势,其权值共享,有效提取特征等优势注定了应用越来越广泛。下面介绍一下经典网络LeNet-5网络。
1、LeNet-5网络
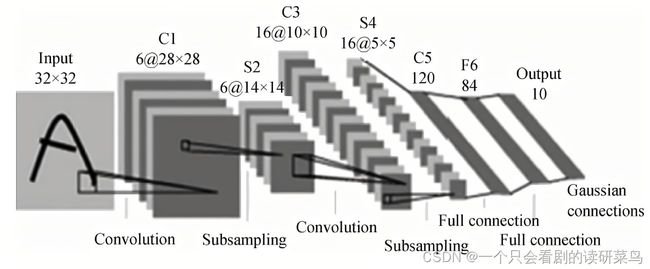
LeNet-5除了输入层外包含七层网络结构,最开始是用来解决手写数字识别问题,由于结构简单,训练效果好而广泛应用。由上图可知,包含两个卷积层,两个池化层,两个全连接层和一个softmax层。
训练过程:
首先输入一个32×32的图片数据,经过6个卷积核大小为5×5的卷积采样后,大小变成了28×28×6;再经过最大池化层,数据变成了14×14×6;再进入第二个卷积层,16个5×5的卷积核进行特征提取,就得到了16×10×10的特征数据;再进入池化层,得到16×5×5的数据;再进入全连接层,利用120个神经元进行数据拉直;再进入第二个全连接层采用84个神经元,降低计算量;最后进入softmax层进行概率计算分类。
2、python案例实现
数据采用cifar-10数据集,里面有各种各样的图片,被收入在keras库中。
import tensorflow as tf
import os
import numpy as np
from matplotlib import pyplot as plt
from tensorflow.keras.layers import Conv2D, BatchNormalization, Activation, MaxPool2D, Dropout, Flatten, Dense
from tensorflow.keras import Model

from sklearn.svm import SVC
np.set_printoptions(threshold=np.inf)

cifar10 = tf.keras.datasets.cifar10
(x_train, y_train), (x_test, y_test) = cifar10.load_data()
x_train, x_test = x_train / 255.0, x_test / 255.0


class LeNet5(Model):
    def __init__(self):
        super(LeNet5, self).__init__()
        self.c1 = Conv2D(filters=6, kernel_size=(5, 5),
                         activation='relu')
        self.p1 = MaxPool2D(pool_size=(2, 2), strides=2)

        self.c2 = Conv2D(filters=16, kernel_size=(5, 5),
                         activation='sigmoid')
        self.p2 = MaxPool2D(pool_size=(2, 2), strides=2)

        self.flatten = Flatten()
        self.f1 = Dense(120, activation='relu')
        self.f2 = Dense(84, activation='relu')
        self.f3 = Dense(10, activation='softmax')

    def call(self, x):
        x = self.c1(x)
        x = self.p1(x)

        x = self.c2(x)
        x = self.p2(x)

        x = self.flatten(x)
        x = self.f1(x)
        x = self.f2(x)
        y = self.f3(x)
        return y


model = LeNet5()

model.compile(optimizer='adam',
              loss=tf.keras.losses.SparseCategoricalCrossentropy(from_logits=False),
              metrics=['sparse_categorical_accuracy'])

checkpoint_save_path = "./checkpoint/LeNet5.ckpt"
if os.path.exists(checkpoint_save_path + '.index'):
    print('-------------load the model-----------------')
    model.load_weights(checkpoint_save_path)

cp_callback = tf.keras.callbacks.ModelCheckpoint(filepath=checkpoint_save_path,
                                                 save_weights_only=True,
                                                 save_best_only=True)

history = model.fit(x_train, y_train, batch_size=64, epochs=20, validation_split=0.1, validation_freq=1,
                    callbacks=[cp_callback])
model.summary()
score = model.evaluate(x_test,y_test)
print(score[1])

# 显示训练集和验证集的acc和loss曲线
acc = history.history['sparse_categorical_accuracy']
val_acc = history.history['val_sparse_categorical_accuracy']
loss = history.history['loss']
val_loss = history.history['val_loss']

plt.subplot(1, 2, 1)
plt.plot(acc, label='Training Accuracy')
plt.plot(val_acc, label='Validation Accuracy')
plt.title('Training and Validation Accuracy')
plt.legend()

plt.subplot(1, 2, 2)
plt.plot(loss, label='Training Loss')
plt.plot(val_loss, label='Validation Loss')
plt.title('Training and Validation Loss')
plt.legend()
plt.show()
看起来效果不是太好,这可能是参数没设置好,也有可能是数据处理上,具体自己使用具体改,哈哈哈!!!


