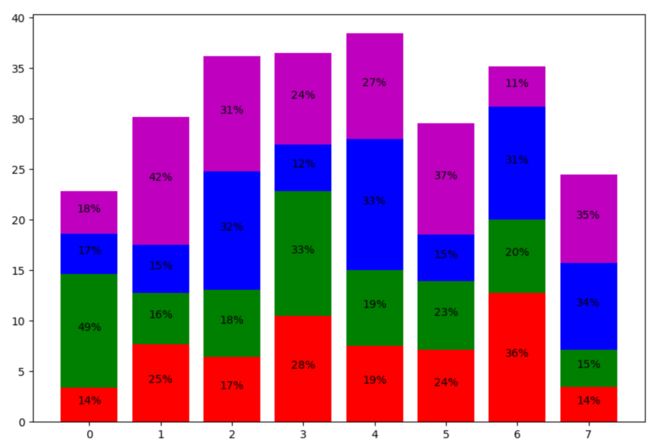
Python绘制比例直方柱状比重图
Python绘制比例直方柱状比重图
把数据分为多少组进行统
组数要适当,太少会有较大的统计误差,太多规律不明显
组数:将数据分组,共分为多少组
组距:指每个小组的两个端点的距离
组数:极差 / 组距,也就是 (最大值-最小值)/ 组距
频数分布直方图与频率分布直方图,hist()方法需增加参数normed
运行结果如下:
全部代码如下:
import numpy as np
import matplotlib.pyplot as plt

people = ('G1','G2','G3','G4','G5','G6','G7','G8')
segments = 4

# multi-dimensional data
data = np.asarray([[  3.40022085,   7.70632498,   6.4097905,   10.51648577,   7.5330039,
    7.1123587,   12.77792868,   3.44773477],
 [ 11.24811149,   5.03778215,   6.65808464,  12.32220677,   7.45964195,
    6.79685302,   7.24578743,   3.69371847],
 [  3.94253354,   4.74763549,  11.73529246,   4.6465543,   12.9952182,
    4.63832778,  11.16849999,   8.56883433],
 [  4.24409799,  12.71746612,  11.3772169,    9.00514257,  10.47084185,
   10.97567589,   3.98287652,   8.80552122]])

percentages = np.zeros((8, 4))
col_sum = np.sum(data, axis=0)
for i in range(data.shape[0]):
    for j in range(len(data[i])):
        percentages[j, i] = data[i, j] / col_sum[j] * 100

y_pos = np.arange(len(people))

fig = plt.figure(figsize=(10,8))
ax = fig.add_subplot(111)

colors ='rgbm'
patch_handles = []

bottom = np.zeros(len(people))
for i, d in enumerate(data):
    patch_handles.append(ax.bar(y_pos, d,
      color=colors[i%len(colors)], align='center',
      bottom=bottom))
    bottom += d

# search all of the bar segments and annotate
for j in range(len(patch_handles)):
    for i, patch in enumerate(patch_handles[j].get_children()):
        bl = patch.get_xy()
        x = 0.5*patch.get_width() + bl[0]
        y = 0.5*patch.get_height() + bl[1]
        ax.text(x,y, "%d%%" % (percentages[i,j]), ha='center')

plt.show()