Python项目实战 —— 01. 疾病预测结构化数据
Python项目实战
- Python项目实战--目录
- Python项目实战 —— 01. 疾病预测结构化数据
-
- 一、背景
- 二、解题思路
- 三、数据分析
-
- 3.1 数据清洗
- 3.2 数据分析
-
- 3.2.1 相关系数
- 3.2.2 各特征与ALF的图表
- 3.3 数据预测
-
- 3.3.1 交叉验证
- 3.3.2 K近邻算法预测疾病
- 3.3.3 朴素贝叶斯预测疾病
- 3.3.4 逻辑回归预测疾病
- 3.3.5 决策树预测疾病
- 四、结论
Python项目实战–目录
Python项目实战 —— 01. 疾病预测结构化数据
大家可以关注知乎或微信公众号的share16,我们也会同步更新此文章。
一、背景
疾病的预测往往能够从病人的病历历史数据挖掘当中获益,而许多有价值的发现也往往是在对于结构化数据的建模与分析之中得出的。通过结构化数据的预测与分析,判断一名病人是否会出现急性肝功能衰竭的情况。
本次数据集,包含6000名20岁以上的成年人在2008-2009和2014-2015的两次调查的情况。数据的采集来自’JPAC Center for Health Diagnosis and Control‘所做的,对全国范围内的成年人的一次调查:通过专业人员的走访研究,数据集涵盖了范围较广的人口信息与他们的健康状况信息,来源自直接访谈、身体检查与血样检查(训练集的比例为70%,测试集的比例为30%)。
点此下载数据集
二、解题思路
本题是要预测病人是否会出现急性肝功能衰竭的情况,结果只有0-1两种可能,所以我们可以采用K近邻算法、朴素贝叶斯、逻辑回归和决策树这几种算法。
补充:自动化参数调优,可以很大程度上减少工作量并提升工作效率。常用的两种参数调优方法是暴力搜索和随机搜索。
- 暴力搜索寻优(GridSearchCV):当待优化参数的取值为离散值时,使用暴力搜索;根据给定的模型自动进行交叉验证,通过调节每一个参数来跟踪评分结果。从本质上说,该过程代替了进行参数搜索时使用的for循环过程。
- 随机搜索寻优(RandomizedSearchCV):当待优化参数的取值为连续值时,使用随机搜索;随机搜索的主要属性和方法与GridSearchCV相同。
三、数据分析
3.1 数据清洗
查重 ➔ 缺失值处理 ➔ 分类变量(如年龄分段处理等) ➔ 将分类变量编码为虚拟指标变量(pd.get_dummies)等,详见文章’机器学习(一)‘的第2.1节内容。
import numpy as np
import pandas as pd
from pyecharts.charts import *
import pyecharts.options as opts
from pyecharts.commons.utils import JsCode
from sklearn.model_selection import train_test_split,cross_val_score
from sklearn.linear_model import LogisticRegression
from sklearn.tree import DecisionTreeClassifier
from sklearn.naive_bayes import BernoulliNB
from sklearn.metrics import roc_auc_score

X = pd.read_csv('/XXXXXX/训练集.csv')
Y = pd.read_csv('/XXXXXX/测试集.csv')

''' 修改列名 '''
x_cols,y_cols = [],[]
for i in X.columns.to_list():
    if '\u2028' in i:
        x_cols.append(i.split('\u2028')[1])
    elif '\n' in i:
        x_cols.append(i.split('\n')[1])
    else:
        x_cols.append(i)

for i in Y.columns.to_list():
    if '\u2028' in i:
        y_cols.append(i.split('\u2028')[1])
    elif '\n' in i:
        y_cols.append(i.split('\n')[1])
    else:
        y_cols.append(i)

X.columns = x_cols
Y.columns = y_cols

''' 填充缺失值 '''
x_name = X.isna().sum()[X.isna().sum()>0].index.to_list()
y_name = Y.isna().sum()[Y.isna().sum()>0].index.to_list()
X[x_name] = X[x_name].fillna(X[x_name].mean())
Y[y_name] = Y[y_name].fillna(Y[y_name].mean())

''' 分类变量 '''
X['Age'] = pd.cut(X.年龄,bins=[19,30,41,52,63,74,85],\
                  labels=['(19,30]','(30,41]','(41,52]','(52,63]','(63,74]','(74,85]'])
Y['Age'] = pd.cut(Y.年龄,bins=[19,30,41,52,63,74,85],\
                  labels=['(19,30]','(30,41]','(41,52]','(52,63]','(63,74]','(74,85]'])

''' 划分数据集 '''
x_new = pd.get_dummies(X,columns=['Age','性别','区域','护理来源']).drop('年龄',axis=1)
x_0 = x_new.drop(columns=['id','ALF'],axis=1)
y_0 = x_new[['id','ALF']]
x_train,x_test,y_train,y_test = train_test_split(x_0,y_0,test_size=0.3,random_state=2022)
3.2 数据分析
3.2.1 相关系数
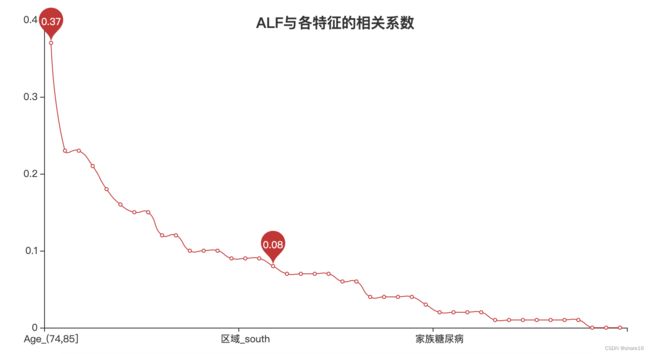
''' 相关系数 '''
r = abs(x_new.corr().round(2).ALF).sort_values(ascending=False).drop('id')
r_name = list(r.index)

l = Line()
l.add_xaxis(list(r.index)[1:])
l.add_yaxis('',list(r)[1:],is_smooth=True,label_opts=opts.LabelOpts(is_show=False),
            markpoint_opts=opts.MarkPointOpts(data=[opts.MarkPointItem(type_='max',name='最大值'),\
                                                    opts.MarkPointItem(type_='average',name='平均值')]))
l.set_global_opts(title_opts=opts.TitleOpts('ALF与各特征的相关系数',pos_top='10%',pos_left='center'))
l.render_notebook()
3.2.2 各特征与ALF的图表
a = X[['id','Age','区域','性别','肝炎','高血压','慢性疲劳','PVD','糖尿病','ALF']].round(2)
a_0 = a.groupby(['ALF','性别']).id.agg('count')
a_1 = a.groupby(['ALF','Age']).id.agg('count')
a_2 = a.groupby(['ALF','区域']).id.agg('count')
a_3 = a.groupby(['ALF','肝炎']).id.agg('count')
a_4 = a.groupby(['ALF','高血压']).id.agg('count')
a_5 = a.groupby(['ALF','慢性疲劳']).id.agg('count')
a_6 = a.groupby(['ALF','PVD']).id.agg('count')
a_7 = a.groupby(['ALF','糖尿病']).id.agg('count')
a_11 = (a_1.loc[1,:]/a_1.reset_index().groupby('Age').id.agg('sum')*100).round(2).reset_index()
a_21 = (a_2.loc[1,:]/a_2.reset_index().groupby('区域').id.agg('sum')*100).round(2).reset_index()
a_31 = (a_3.loc[1,:]/a_3.reset_index().groupby('肝炎').id.agg('sum')*100).round(2).fillna(0)
a_41 = (a_4.loc[1,:]/a_4.reset_index().groupby('高血压').id.agg('sum')*100).round(2).fillna(0)
a_51 = (a_5.loc[1,:]/a_5.reset_index().groupby('慢性疲劳').id.agg('sum')*100).round(2).fillna(0)
a_61 = (a_6.loc[1,:]/a_6.reset_index().groupby('PVD').id.agg('sum')*100).round(2).fillna(0)
a_71 = (a_7.loc[1,:]/a_7.reset_index().groupby('糖尿病').id.agg('sum')*100).round(2).fillna(0)


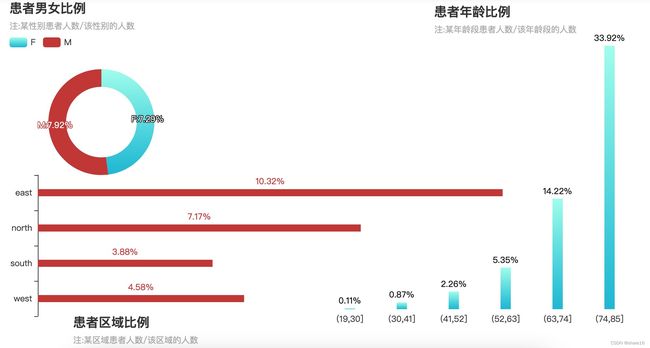
''' 性别/年龄/区域与ALF '''
p1 = Bar()
p1.add_xaxis(list(a_11.Age))
p1.add_yaxis('',list(a_11.id),bar_width='20%',label_opts=opts.LabelOpts(formatter='{c}%'),
            color=JsCode("""new echarts.graphic.LinearGradient(0,0,0,1,\
            [{offset:0,color:'#9DFEEC'},{offset:1,color:'#08B6D4'}],false)"""))
p1.set_global_opts(xaxis_opts=opts.AxisOpts(axisline_opts=opts.AxisLineOpts(is_show=False),
                                            axistick_opts=opts.AxisTickOpts(is_show=False)),
                   yaxis_opts=opts.AxisOpts(is_show=False),
                   title_opts=opts.TitleOpts(title='患者年龄比例',subtitle='注:某年龄段患者人数/该年龄段的人数',
                                             pos_top='1%',pos_right='10%'))

p2 = Bar()
p2.add_xaxis(list(a_21.区域))
p2.add_yaxis('',list(a_21.id),bar_width='20%',label_opts=opts.LabelOpts(formatter='{c}%'))
p2.reversal_axis()
p2.set_global_opts(xaxis_opts=opts.AxisOpts(is_show=False),yaxis_opts=opts.AxisOpts(is_inverse=True),
                   title_opts=opts.TitleOpts(title='患者区域比例',subtitle='注:某区域患者人数/该区域的人数',
                                             pos_bottom='1%',pos_left='10%'))

p3 = Pie()
p3.add('',list((a_0.loc[1,:]/a_0.reset_index().groupby('性别').id.agg('sum')*100).round(2).to_dict().items()),
       radius=['20%','30%'],center=['15%','35%'],
       label_opts=opts.LabelOpts(position='inside',formatter='{b}:{c}%'))
p3.set_global_opts(title_opts=opts.TitleOpts(title='患者男女比例',subtitle='注:某性别患者人数/该性别的人数'),
                   legend_opts=opts.LegendOpts(pos_top='10%',pos_left='left'))

grid = Grid()
grid.add(p1,grid_opts=opts.GridOpts(pos_top='11%',pos_left='50%',pos_right='1%'))
grid.add(p2,grid_opts=opts.GridOpts(pos_top='50%',pos_bottom='10%',pos_left='5%'))
grid.add(p3,grid_opts=opts.GridOpts(pos_top='11%',pos_left='1%'))
grid.render_notebook()
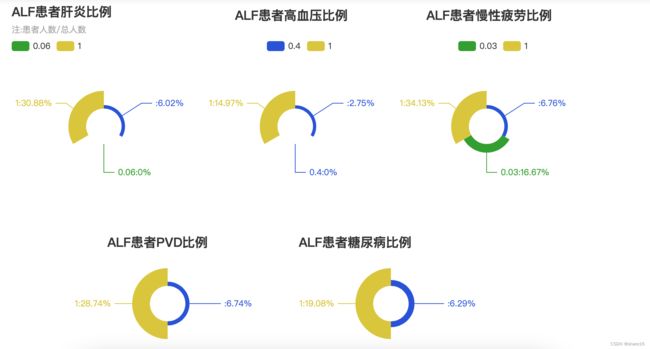
p4 = Pie()
p4.add('',list(a_31.to_dict().items()),radius=['10%','20%'],center=['15%','35%'],rosetype='area',
       label_opts=opts.LabelOpts(formatter='{b}:{c}%'))
p4.set_colors(['#254EDB','#2CA127','#DBC72A'])
p4.set_global_opts(title_opts=opts.TitleOpts(title='ALF患者肝炎比例',subtitle='注:患者人数/总人数'),
                   legend_opts=opts.LegendOpts(pos_top='10%',pos_left='left'))

p5 = Pie()
p5.add('',list(a_41.to_dict().items()),radius=['10%','20%'],center=['45%','35%'],rosetype='area',
       label_opts=opts.LabelOpts(formatter='{b}:{c}%'))
p5.set_colors(['#254EDB','#2CA127','#DBC72A'])
p5.set_global_opts(title_opts=opts.TitleOpts(title='ALF患者高血压比例',pos_top='1%',pos_left='35%'),
                   legend_opts=opts.LegendOpts(pos_top='10%',pos_left='40%'))

p6 = Pie()
p6.add('',list(a_51.to_dict().items()),radius=['10%','20%'],center=['75%','35%'],rosetype='area',
       label_opts=opts.LabelOpts(formatter='{b}:{c}%'))
p6.set_colors(['#254EDB','#2CA127','#DBC72A'])
p6.set_global_opts(title_opts=opts.TitleOpts(title='ALF患者慢性疲劳比例',pos_top='1%',pos_left='65%'),
                   legend_opts=opts.LegendOpts(pos_top='10%',pos_left='70%'))

p7 = Pie()
p7.add('',list(a_61.to_dict().items()),radius=['10%','20%'],center=['25%','85%'],rosetype='area',
       label_opts=opts.LabelOpts(formatter='{b}:{c}%'))
p7.set_colors(['#254EDB','#2CA127','#DBC72A'])
p7.set_global_opts(title_opts=opts.TitleOpts(title='ALF患者PVD比例',pos_top='65%',pos_left='15%'),
                   legend_opts=opts.LegendOpts(is_show=False))

p8 = Pie()
p8.add('',list(a_71.to_dict().items()),radius=['10%','20%'],center=['60%','85%'],rosetype='area',
       label_opts=opts.LabelOpts(formatter='{b}:{c}%'))
p8.set_colors(['#254EDB','#2CA127','#DBC72A'])
p8.set_global_opts(title_opts=opts.TitleOpts(title='ALF患者糖尿病比例',pos_top='65%',pos_left='45%'),
                   legend_opts=opts.LegendOpts(is_show=False))

grid = Grid()
grid.add(p4,grid_opts=opts.GridOpts(pos_top='20%',pos_left='10%'))
grid.add(p5,grid_opts=opts.GridOpts(pos_top='20%',pos_left='10%'))
grid.add(p6,grid_opts=opts.GridOpts(pos_top='20%',pos_left='10%'))
grid.add(p7,grid_opts=opts.GridOpts(pos_top='20%',pos_left='10%'))
grid.add(p8,grid_opts=opts.GridOpts(pos_top='20%',pos_left='10%'))
grid.render_notebook()
3.3 数据预测
3.3.1 交叉验证
''' 交叉验证,选出K个特征 '''
score = []
lr = LogisticRegression(solver='lbfgs',max_iter=6000)
for i in range(2,45):
    s = cross_val_score(lr,x_train.loc[:,r_name[1:i]],y_train.iloc[:,1]).mean()
    score.append(s)
k = range(2,45)[score.index(max(score))]
3.3.2 K近邻算法预测疾病
''' 暴力搜索-KNN '''
parameter = {'n_neighbors':range(2,22)}
clf2 = GridSearchCV(KNeighborsClassifier(),parameter,cv=10)
clf2.fit(x_train.loc[:,r_name[1:k]],y_train.iloc[:,1])
print('暴力搜索的最优参数组合:{}'.format(clf2.best_params_))
print('暴力搜索的最优学习器评分:',clf2.best_score_)

y_new = pd.get_dummies(Y,columns=['Age','性别','区域','护理来源']).drop('id',axis=1)
df = pd.DataFrame(data=clf2.predict(y_new.loc[:,r_name[1:k]]),index=Y.id,columns=['ALF']).reset_index()
#df.to_csv('/XXXXXX/df.csv',index=False)
#print('打印完成!')
df.ALF.sum()
运行结果:
暴力搜索的最优参数组合:{‘n_neighbors’: 11}
暴力搜索的最优学习器评分:0.9231292517006804
预测的患者人数:5
3.3.3 朴素贝叶斯预测疾病
''' 贝叶斯-二项分布 '''
clf1 = BernoulliNB()
clf1.fit(x_train.loc[:,r_name[1:k]],y_train.iloc[:,1])
print('贝叶斯得分:',clf1.score(x_train.loc[:,r_name[1:k]],y_train.iloc[:,1]))
y_pre = clf1.predict(x_test.loc[:,r_name[1:k]])
print('贝叶斯auc值:',roc_auc_score(y_test.iloc[:,1],y_pre))

''' 预测新数据 '''
y_new = pd.get_dummies(Y,columns=['Age','性别','区域','护理来源']).drop('id',axis=1)
df = pd.DataFrame(data=clf1.predict(y_new.loc[:,r_name[1:k]]),index=Y.id,columns=['ALF']).reset_index()
#df.to_csv('/XXXXXX/df.csv',index=False)
#print('打印完成!')
df.ALF.sum()
运行结果:
贝叶斯得分:0.8826530612244898
贝叶斯auc值:0.7482117440969309
预测的患者人数:201
3.3.4 逻辑回归预测疾病
''' 逻辑回归 '''
lr.fit(x_train.loc[:,r_name[1:k]],y_train.iloc[:,1])
print('逻辑回归得分:',lr.score(x_train.loc[:,r_name[1:k]],y_train.iloc[:,1]))
y_pre = lr.predict(x_test.loc[:,r_name[1:k]])
print('逻辑回归auc值:',roc_auc_score(y_test.iloc[:,1],y_pre))

''' 预测新数据 '''
y_new = pd.get_dummies(Y,columns=['Age','性别','区域','护理来源']).drop('id',axis=1)
df = pd.DataFrame(data=lr.predict(y_new.loc[:,r_name[1:k]]),index=Y.id,columns=['ALF']).reset_index()
#df.to_csv('/XXXXXX/df.csv',index=False)
#print('打印完成!')
df.ALF.sum()
运行结果:
逻辑回归得分:0.9258503401360544
逻辑回归auc值:0.5595416225685194
预测的患者人数:35
3.3.5 决策树预测疾病
''' 决策树 '''
clf = DecisionTreeClassifier()
clf.fit(x_train.loc[:,r_name[1:k]],y_train.iloc[:,1])
print('决策树得分:',clf.score(x_train.loc[:,r_name[1:k]],y_train.iloc[:,1]))
y_pre = clf.predict(x_test.loc[:,r_name[1:k]])
print('决策树auc值:',roc_auc_score(y_test.iloc[:,1],y_pre))

''' 预测新数据 '''
y_new = pd.get_dummies(Y,columns=['Age','性别','区域','护理来源']).drop('id',axis=1)
df = pd.DataFrame(data=clf.predict(y_new.loc[:,r_name[1:k]]),index=Y.id,columns=['ALF']).reset_index()
#df.to_csv('/XXXXXX/df.csv',index=False)
#print('打印完成!')
df.ALF.sum()
运行结果:
决策树得分:1.0
决策树auc值:0.6259534323564834
预测的患者人数:141
四、结论
经上述可知,
① 女性患者略高于男性;
② 年龄越大,出现急性肝功能衰竭状况的可能性越高,年纪在74~85岁之间,有疾的概率可达34%;
③ 当人有肝炎、慢性疲劳、PVD的状况时,有疾的概率可达30%;
④ 此次预测中,朴素贝叶斯-二项分布的auc值最好;

谢谢大家


