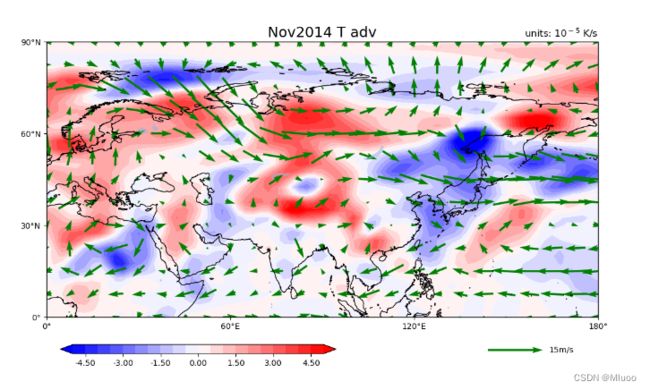
【气象】python计算平流并cartopy绘图(计算差分、弧度制转化、广播运算)
一、总代码:
import xarray as xr
import numpy as np

import cartopy.crs as ccrs
import cartopy.feature as cfeature
import matplotlib.pyplot as plt
import cartopy.mpl.ticker as cticker
from cartopy.util  import  add_cyclic_point

class T_advection(object):
    def __init__(self,file_u,file_v,file_t):
        self.f_u = xr.open_dataset(file_u)
        self.f_v = xr.open_dataset(file_v)
        self.f_t = xr.open_dataset(file_t)

        pass

    def cal_advection(self):
        a = 6370000
        u0 = self.f_u.uwnd.loc['2014-11-01',850,90:0,0:180]
        v0 = self.f_v.vwnd.loc['2014-11-01',850,90:0,0:180]
        t = self.f_t.air.loc['2014-11-01',850,90:0,0:180]
        lon0 = u0.lon
        lat0 = u0.lat
        dlon = (np.gradient(lon0)*np.pi/180).reshape((1,-1))
        dlat = (np.gradient(lat0)*np.pi/180).reshape((-1,1))
        coslat = (np.array(np.cos((lat0)*np.pi/180))).reshape((-1,1))
        dx = a*coslat*dlon
        dy = a*dlat
        temadvection0 = -(u0 * np.gradient(np.array(t),axis = 1)/dx + v0 * np.gradient(np.array(t),axis = 0)/dy)

        return lon0,lat0,u0,v0,temadvection0

    def draw_cmap_advection(self,lon,lat,u,v,temadvection):
        #设置投影范围
        proj = ccrs.PlateCarree(central_longitude=90)
        leftlon, rightlon, lowerlat, upperlat = (0,180,0,90)
        img_extent = [leftlon, rightlon, lowerlat, upperlat]

        #添加基础要素(海岸线、湖泊、坐标等)
        fig = plt.figure(figsize=(12,8))
        ax = fig.add_axes([0.1,0.1,0.8,0.8],projection=proj)
        ax.set_extent(img_extent,crs=ccrs.PlateCarree())
        ax.set_title('Nov2014 T adv',loc='center',fontsize=18)
        ax.set_title(r'units: 10$^-$$^5$ K/s',loc='right',fontsize=12)
        ax.add_feature(cfeature.COASTLINE.with_scale('50m'))
        ax.add_feature(cfeature.LAKES,alpha=0.5)
        ax.set_xticks(np.array([0,60,120,180]), crs=ccrs.PlateCarree())
        ax.set_yticks(np.array([0,30,60,90]), crs=ccrs.PlateCarree())
        ax.xaxis.set_major_formatter(cticker.LongitudeFormatter())
        ax.yaxis.set_major_formatter(cticker.LatitudeFormatter())

        #添加数据(quiver,contourf,colorbar)
        q1 = ax.quiver(lon[::3],lat[::3], u.values[::3,::3], v.values[::3,::3] ,pivot='mid',
        scale = 150,color='g',width=0.0038,headwidth=3, transform=ccrs.PlateCarree())
        ax.quiverkey(q1, X=0.9, Y=-0.12, U=15,label='15m/s', labelpos='E')
        c1 = ax.contourf(lon,lat, temadvection/1e-05, zorder=0,levels =np.arange(-5,5.5,0.5),extend = 'both', transform=ccrs.PlateCarree(), cmap=plt.cm.bwr)
        position=fig.add_axes([0.12, 0.12,  0.4, 0.02])
        fig.colorbar(c1,cax=position,orientation='horizontal',format='%.2f',)


        plt.savefig('T_advection.png')

        pass


#实例化对象
a = T_advection('/mnt/g/st_touchfish_py/data/uwnd.mon.mean.nc','/mnt/g/st_touchfish_py/data/vwnd.mon.mean.nc','/mnt/g/st_touchfish_py/data/air.mon.mean.nc')
lon1,lat1,u1,v1,temadvection1 = a.cal_advection()
a.draw_cmap_advection(lon1,lat1,u1,v1,temadvection1)
二、解析与注意事项:
(1)平流公式如下图:
u、v可以直接从nc文件提出来,我们只需要计算dt、dx、dy即可。
( dx = a*coslat*dlon ; dy = a*dlat 其中a是地球半径)
(2)计算差分、弧度制转化、广播运算
计算差分用的是np.gradient()函数,返回值是一个和输入数组相同大小的数组。
需要注意,在python中计算的时候需要将角度制转为弧度制(方法:角度*np.pi/180)
因此:dlon = (np.gradient(lon0)*np.pi/180)
本来这样就可以了,但由于公式中的u,v是二维数组,为了能和他们进行运算,需要将一维数据变成二维(即:广播运算)
因此:dlon = (np.gradient(lon0)*np.pi/180).reshape((1,-1))其中1就是扩充第0维,-1就是保留第1维。
最后将它们带入公式计算:temadvection0 = -(u0 * np.gradient(np.array(t),axis = 1)/dx + v0 * np.gradient(np.array(t),axis = 0)/dy)
绘图结果如下:

