【OpenCV-Python】教程:3-10 直方图(1)查找显示分析
OpenCV Python 直方图 查找显示分析
【目标】
OpenCV,NumPy查找计算直方图信息OpenCV,Matplotlib显示查看直方图- 学习
cv.calcHist(),np.histogram() - 通道分离
split
【理论】
什么是直方图?
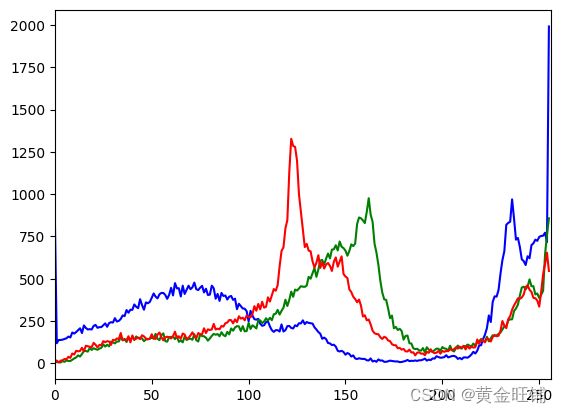
直方图是统计图像中像素亮度或颜色等分布的一种常用工具,几乎所有图像处理的工具都提供了这种工具,X轴表示 0~255(刻度大小与Bin设置有关系),Y轴统计个数(频率)。
【代码】
- OpenCV版本
import cv2
import numpy as np

src = cv2.imread('test_hist.png')
if src is None:
    print('Could not open or find the image:', 'test_hist.png')
    exit(0)

# 分离3通道
bgr_planes = cv2.split(src)

# bin的数量
histSize = 256
histRange = (0, 256)  # the upper boundary is exclusive
accumulate = False

# 计算各通道的直方图信息
b_hist = cv2.calcHist(bgr_planes, [0], None, [
                    histSize], histRange, accumulate=accumulate)
g_hist = cv2.calcHist(bgr_planes, [1], None, [
                    histSize], histRange, accumulate=accumulate)
r_hist = cv2.calcHist(bgr_planes, [2], None, [
                    histSize], histRange, accumulate=accumulate)

# 显示直方图图像的宽高
hist_w, hist_h = 512, 400
# bin 显示实际宽度
bin_w = int(round(hist_w/histSize))
histImage = np.zeros((hist_h, hist_w, 3), dtype=np.uint8)

# 数据归一化,方便显示,最小最大归一化,最小为0,最大为显示图像的高度
cv2.normalize(b_hist, b_hist, alpha=0, beta=hist_h, norm_type=cv2.NORM_MINMAX)
cv2.normalize(g_hist, g_hist, alpha=0, beta=hist_h, norm_type=cv2.NORM_MINMAX)
cv2.normalize(r_hist, r_hist, alpha=0, beta=hist_h, norm_type=cv2.NORM_MINMAX)

# 画线的方式显示信息,每个线的颜色为统计颜色
for i in range(1, histSize):
    cv2.line(histImage, (bin_w*(i-1), hist_h - int(b_hist[i-1])),
            (bin_w * (i), hist_h - int(b_hist[i])),
            (255, 0, 0), thickness=2)
    cv2.line(histImage, (bin_w*(i-1), hist_h - int(g_hist[i-1])),
            (bin_w * (i), hist_h - int(g_hist[i])),
            (0, 255, 0), thickness=2)
    cv2.line(histImage, (bin_w*(i-1), hist_h - int(r_hist[i-1])),
            (bin_w * (i), hist_h - int(r_hist[i])),
            (0, 0, 255), thickness=2)

cv2.imshow('Source image', src)
cv2.imshow('calcHist Demo', histImage)
cv2.waitKey(0)
cv2.destroyAllWindows()
import numpy as np
import cv2 as cv
from matplotlib import pyplot as plt

# img = cv2.imread('test_hist.png', 0)
# plt.hist(img.ravel(),256,[0,256]);
# plt.show()

img = cv2.imread('test_hist.png')
color = ('b', 'g', 'r')
for i, col in enumerate(color):
    histr = cv.calcHist([img], [i], None, [256], [0, 256])
    plt.plot(histr, color=col)
    plt.xlim([0, 256])
plt.show()
【接口】
- calcHist
cv.calcHist( images, channels, mask, histSize, ranges[, hist[, accumulate]] ) -> hist
计算一个数组的直方图统计信息
- images: 源数组s,可以是 uint8 或者 float32格式的,但是必须以
[img]的方式提供参数- channels: 也必须以
[0]或[1],[2]的形式出现,如果是灰度图像,直接用[0]即可;- mask: 可选的掩码,如果不为空,必须是8位的数组或图像大小与 images[i]相同,非零位置像素统计计算;
- histSize: 如果是8位图像,并且要全部统计的话,用
[256],当然也可以用[32]等值- ranges: 通常情况下是
[0, 256]- hist: 输出的直方图,是一个密集或稀疏的数组(dims维)
- accumulate: 是否累积? 多个数组集合累积到单个直方图里。
【参考】
- OpenCV 官方文档
- 直方图计算


