python数据可视化(matplotlib,seaborn,plotly)
文章目录
- 资料链接
-
- Matplotlib绘图基础
- 简单图形绘制
-
- 1.饼图
- 2.条形图
- 3.直方图
- 4.散点图
- 图形基本设置
- 统计图形实战
-
- 1.柱状图(堆积柱状图)
- 2.直方图(直方图,核密度图,正态分布图)
- 3.箱线图
- 4.散点图
- 5.折线图
- 完善统计图形
-
- 1.图例和画布使用
- 2.调整刻度轴
- 3.图形添加内容
-
- 3.1.无指向型注释文本
- 3.2.有指向型注释文本
- 图形样式高级操作
-
- 1.绘制双坐标轴
- 2.多个图形合并
-
- 2.1.subplot()
- 2.2.subplot2grid()
- Seaborn基础
- 绘制常用统计图形
-
- sns.barplot(x,y):柱状图
- sns.scatter(x,y):散点图
- sns.barplot:箱线图
- sns.distplot,sns.displot:直方图
- 其他参数和图形
-
- 1.折线图
- 2.回归图
- 3.条形图
- Plotly介绍和基础
- 常见图形绘制
-
- 1.散点图
- 2.折线图
- 3.柱状图
- 4.直方图
- 5.饼图
- 图形设置
资料链接
B站云开见明-python可视化
https://www.bilibili.com/video/BV1eJ411H79t?p=8&share_source=copy_web
博客里用到的数据和代码:
链接:https://pan.baidu.com/s/1r5JJdZzrCejgy9NGXbsFQQ
提取码:mxmf
Matplotlib绘图基础
matplotlib官网
plt.plot(xy,ls=,lwe=,c=,marker=,markersize=,markeredgecolor-,markerfacecolor, label=)
- x∶x轴上的数值
- y∶ y轴上的数值
- ls∶折线的风格(‘-’,‘–’,‘-.’,‘:’)
- lw∶ 线条宽度
- c∶ 颜色
- marker∶线条上点的形状
- markersize∶线条上点的大小
- markeredgecolor∶点的边框色
- markerfacecolor∶点的填充色
- label∶文本标签
import numpy as np
import matplotlib.pyplot as plt
#确保图形能正确展示处理
%matplotlib inline
x=np.linspace(0,100,1000)
y=np.sin(x)
#plt.plot()绘制折线图
#c线条颜色 lw线条宽度 ls线条风格
#plt.show()展现图形
plt.plot(x,y,c='red',lw=2,ls='--')
plt.show()
#marker点的形状 markersize点的大小 markeredgecolor点的边框颜色
#markerfacecolor点的实心填充色
plt.plot(x,y,ls='-',marker='o',markersize=5,c='red'
         ,markeredgecolor='blue',markerfacecolor='w',
        label='x和y的关系')
plt.show()
plt.rcParams['font.sans-serif']=['SimHei']#解决中文乱码
plt.rcParams['axes.unicode_minus']=False#解决符号乱码
x=np.linspace(0,10,100)
y=np.sin(x)
plt.plot(x,y,ls=':',lw=2,label='y=sin(x)')
plt.legend(loc='upper center')#展示图例 loc位置关系 loc还可为center等
x=np.arange(0,1.1,0.01)
y=x**2
#figsize画布大小dpi分辨率facecolor画布边框色
plt.figure(figsize=(4,4),dpi=100,facecolor='white')
plt.title('这是一幅画')
plt.xlabel('x1')#标签
plt.ylabel('y')
plt.xlim=([0,1])#范围
plt.ylim([0,1])
plt.xticks([0,0.2,0.4,0.6,0.8,1])#刻度
plt.yticks([0,0.2,0.4,0.6,0.8,1])
plt.plot(x,y,label='y=x^2')
plt.legend(loc='best')
#保存图片,名称可为png,pdf
plt.savefig(r'C:\Users\郝琪英\Desktop\可视化.pdf')
plt.show()
简单图形绘制
1.饼图
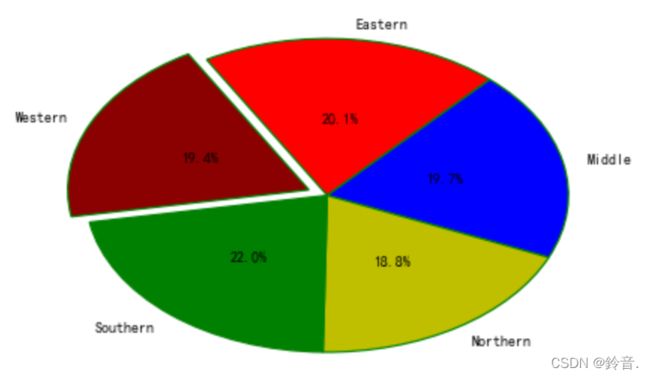
饼图用于实现可视化离散型变量的分布的一种图形
pie(x,explode,labels,colors,autopct=,pctdistance,shadow,startangle,radius,wedgeprops,textprops,center)
- labels∶标签
- colors∶颜色
- autopct∶百分比
- pctdistance∶百分比标签与圆心距离
- shadow∶是否添加饼图阴影效果
- labeldistance∶设置各扇形标签与圆心距离
- startangle∶设置饼图的初始摆放角度
- radius∶设置饼图半径大小
- counterclock∶是否逆时针呈现
- wedgeprops∶设置饼图内外边界的属性
- textprops∶设置饼图中文本属性
- center∶设置中心位置
import pandas as pd
import numpy as np
import matplotlib.pyplot as plt
%matplotlib inline
import os
os.chdir('.\数据')
data=pd.read_excel('非洲通讯产品销售数据.xlsx',sheet_name='SalesData')
data.head()
data_1=data.groupby('地区').mean()['销售额']
x_data=data_1.values
y_data=data_1.index
#每部分突出大小
explode = [0,0,0,0,0.1]
colors=['red','blue','purple','green','darkred']#purple
plt.rcParams['font.sans-serif']=['SimHei']
plt.rcParams['axes.unicode_minus']=False
#autopct设置为百分比格式 pctdistance百分比标签与圆心距离
#labeldistance设置文本标签与圆心距离 startangle设置饼图初始角度
#radius设置饼图半径 counterclock是否逆时针
#wedgeprops边的宽度以及边框色textprops文本信息

#官网:https://matplotlib.org/stable/api/_as_gen/matplotlib.pyplot.title.html

plt.pie(x=x_data,explode=explode,labels=y_data,colors=colors,
       autopct='%.1f%%',pctdistance=0.5,labeldistance=1.1,
       startangle=120,radius=1.2,counterclock=False,
       wedgeprops={'linewidth':1.2,'edgecolor':'green'},
       textprops={'fontsize':10,'color':'black'})
# plt.title('订单金额分布图')#pad标题距离坐标轴距离
plt.show()
2.条形图
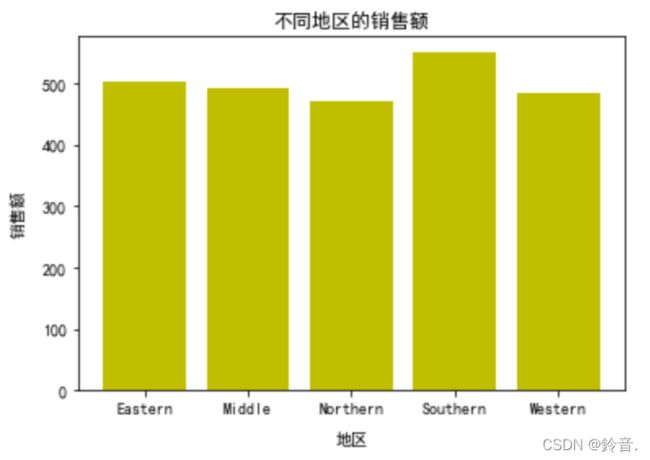
饼图不适合取值过多的分类特征,条形图不仅适合分类水平较多的变量也更加适合对比差异.具体请见案例
bar(x, y,width,bottom,color,linewidth,tick_label,align)
- x指定x轴上数值
- y指定y轴上数值
- width指定条形图宽度
- color条形图的填充色
- edge条形图的边框色
- linewidth条形图边框宽度
- tick_label条形图的刻度标签
- align指定x轴上对齐方式
x_data=data_1.values
y_labels=data_1.index
plt.bar(x=range(0,len(x_data)),height=x_data,align='center',
       color='y',tick_label=y_labels)
plt.xlabel('地区',labelpad=10)
plt.ylabel('销售额',labelpad=10)
plt.title('不同地区的销售额')
plt.show()
3.直方图
对于连续型变量,往往需要查看其分布图,直方图就是用来观察数据的分布形态plt.hist(x,bins,range,normed,cumulative,bottom,align,rwidth,color,edgecolor,label)
- x数据
- bin条形个数
- range上下界
- normed是否将频数转换成频率
- cumulative是否计算累计频率
- bottom为直方图的每个条形添加基准线,默认为0
- align对齐方式
- rwidth条形的宽度
- color填充色
- edgecolor设置直方图边框色
- label设置直方图标签
data.head()
#销售额在某一区间内出现的次数
#bin格子的个数 density是否以频数的形式展示
plt.hist(x=data['销售额'],bins=30,color='r',edgecolor='black',
         density=False)
plt.title('销售额分布图')
plt.show()
4.散点图
散点图一般用来展示2个连续型变量的的关系,可以通过散点图来判断两个变量之间是否存在某种关系,例如线性还是非线性关系
plt.scatter(x,y, s, c, marker, cmap, norm, alpha, linewidths, edgecolorsl)
- x x数据
- y y轴数据
- s 散点大小
- c 散点颜色
- marker 散点图形状
- cmap 指定某个colormap值,该参数一般不用,用默认值
- alpha 散点的透明度
- linewidths 散点边界线的宽度
- edgecolors 设置散点边界线的颜色
SalePrice - 以美元为单位的房产销售价格。
LotArea:以平方英尺为单位的地块面积
sec_buildings=pd.read_csv('train.csv')
sec_buildings.head()
#SalePrice - 以美元为单位的房产销售价格。
#LotArea:以平方英尺为单位的地块面积
plt.scatter(x=sec_buildings['LotArea'],
            y=sec_buildings['SalePrice'],
            color='steelblue',marker='o',s=100)
plt.xlabel('房子大小',fontsize=14)
plt.ylabel('房子总价',fontsize=14)
plt.title('房子大小和房子总价关系',fontsize=14)
plt.show()
图形基本设置
plt.plot(data_1.index,data_1.values,label='不同地区销售额')
#loc='best'根据图自动匹配最好位置 frameon是否有边框
plt.legend(loc='upper left',fontsize=12,frameon=True)
#设置图像
# fig=plt.gcf()
# fig.set_size_inches(12.5,10.5)#调整图片大小(画布长宽)
# plt.grid(ls='--',c='red')#  -,-.,--.:
plt.axhline(y=500,c='red',ls='--',lw=2)#画线y=500
plt.axvline(x=2,c='red',ls='--',lw=2)#画线x=2
plt.show()
plt.plot(data_1.index,data_1.values,label='不同地区销售额')
#loc='best'根据图自动匹配最好位置 frameon是否有边框
plt.legend(loc='upper left',fontsize=12,frameon=True)
#alpha参数透明度,可给可不给
plt.axvspan(xmin=3,xmax=5,facecolor='r',alpha=0.3)#画出x为3-5的区域
plt.axhspan(ymin=480,ymax=510,facecolor='r',alpha=0.3)#画出y为480-510的区域
plt.show()
统计图形实战
1.柱状图(堆积柱状图)
柱状图主要应用在定性数据的可视化场景里面,或者是分类特征的分布展示,那么由柱状图衍生出来的图形还有堆积柱状图,多数据并列柱状图
import pandas as pd
import numpy as np
import matplotlib.pyplot as plt
plt.rcParams['font.sans-serif']=['SimHei']
plt.rcParams['axes.unicode_minus']=False
GDP=pd.read_excel('Province GDP 2017.xlsx')
GDP
plt.figure(figsize=(6.4,4.8))
plt.bar(x=GDP.index.values,height=GDP.GDP,width=0.5)
#rotation字体旋转倾斜
plt.xticks(GDP.index.values,GDP.Province,rotation=45)
plt.xlabel('省份',fontsize=14)
plt.ylabel('GDP产值(万亿)',fontsize=14,labelpad=20)
plt.title('2017年GDP情况',fontsize=20)
plt.show()
Industry_GDP=pd.read_excel('Industry_GDP.xlsx')
Industry_GDP
#透视表
temp=pd.pivot_table(data=Industry_GDP,index='Quarter',columns='Industry_Type',
                   values='GDP',aggfunc=np.sum)
temp
#tick_label为行索引打标签,把Q1,Q2,Q3,Q4变为'第一季度','第二季度','第三季度','第四季度'
#bottom表示第二产业是在第一产业上面的,第三产业在第一产业和第二产业之上的,由堆叠图可看出
plt.bar(x=temp.index.values,height=temp['第一产业'],color='steelblue',
       label='第一产业',tick_label=['第一季度','第二季度','第三季度','第四季度'],)
plt.bar(x=temp.index.values,height=temp['第二产业'],color='green',
       label='第二产业',bottom=temp['第一产业'],tick_label=['第一季度','第二季度','第三季度','第四季度'],)
plt.bar(x=temp.index.values,height=temp['第三产业'],color='red',
       label='第三产业',bottom=temp['第一产业']+temp['第二产业'],tick_label=['第一季度','第二季度','第三季度','第四季度'])
plt.ylabel('产值(亿)')
plt.title('2017年各行业各季度生产值')
plt.show()
temp=pd.crosstab(Industry_GDP['Quarter'],Industry_GDP['Industry_Type'],
                values=Industry_GDP['GDP'],aggfunc=np.sum,normalize='index')
temp
#tick_label为行索引打标签,把Q1,Q2,Q3,Q4变为'第一季度','第二季度','第三季度','第四季度'
#bottom表示第二产业是在第一产业上面的,第三产业在第一产业和第二产业之上的,由堆叠图可看出
plt.bar(x=temp.index.values,height=temp['第一产业'],color='steelblue',
       label='第一产业',tick_label=['第一季度','第二季度','第三季度','第四季度'],)
plt.bar(x=temp.index.values,height=temp['第二产业'],color='green',
       label='第二产业',bottom=temp['第一产业'],tick_label=['第一季度','第二季度','第三季度','第四季度'],)
plt.bar(x=temp.index.values,height=temp['第三产业'],color='red',
       label='第三产业',bottom=temp['第一产业']+temp['第二产业'],tick_label=['第一季度','第二季度','第三季度','第四季度'])
plt.ylabel('产值(亿)')
plt.title('2017年各行业各季度生产值')
plt.legend(loc='best')
plt.show()
#从图中可看出蓝色部分第一产业,四个季度依次上升
#红色部分第三产业四个季度产值下降了
#修改图例到最右边
plt.bar(x=temp.index.values,height=temp['第一产业'],color='steelblue',
       label='第一产业',tick_label=['第一季度','第二季度','第三季度','第四季度'],)
plt.bar(x=temp.index.values,height=temp['第二产业'],color='green',
       label='第二产业',bottom=temp['第一产业'],tick_label=['第一季度','第二季度','第三季度','第四季度'],)
plt.bar(x=temp.index.values,height=temp['第三产业'],color='red',
       label='第三产业',bottom=temp['第一产业']+temp['第二产业'],tick_label=['第一季度','第二季度','第三季度','第四季度'])
plt.ylabel('产值(亿)')
plt.title('2017年各行业各季度生产值')
#把横轴看为1,纵轴看为1,
#1.08表示距离纵轴的距离
#0.8表示距离横轴的距离
plt.legend(bbox_to_anchor=(1.08,0.8))
plt.show()
2.直方图(直方图,核密度图,正态分布图)
直方图,一般用来观察数据的分布形态,横坐标代表数值的分段,纵坐标代表了观测数量和频数,直方图有时候会和核密度图搭配使用,主要是为了更加详细的展示数据的分布特征
Titanic=pd.read_csv('titanic_train.csv')
#删除掉年龄的缺失值
Titanic.dropna(subset=['Age'],inplace=True)
#density=True频率形式展现
plt.hist(x=Titanic['Age'],bins=20,color='c',
         edgecolor='red',density=True)
plt.xlabel('年龄',fontsize=15)
plt.ylabel('频率',fontsize=15)
plt.title('年龄分布图',fontsize=20)
plt.show()
#正态分布图
def normfun(x,mu,sigma):
    pdf=np.exp( -((x-mu)**2)/(2*sigma*2))/(sigma*np.sqrt(2*np.pi))
    return pdf
mean_x=Titanic['Age'].mean()
std_x=Titanic['Age'].std()
x=np.arange(Titanic['Age'].min(),Titanic['Age'].max()+10,1)
y=normfun(x,mean_x,std_x)

plt.hist(x=Titanic['Age'],bins=35,color='c',
         edgecolor='red',density=True,label='直方分布图')
#核密度图 线性模式展现出来
Titanic['Age'].plot(kind='kde',color='red',xlim=[0,90],label='核密度图')
plt.plot(x,y,color='g',linewidth=3,label='正态分布图')
plt.xlabel('年龄',fontsize=15)
plt.ylabel('频率',fontsize=15)
plt.title('年龄分布图')
plt.legend(loc='best')
plt.show()
3.箱线图
箱线图是由一个箱体和一对箱须组成的统计图形。箱体是由第一四分位数,中位数和第三四分位数所组成的。在箱须的末端之外的数值可以理解成离群值,箱线图可以对一组数据范围大致进行直观的描述
数据:
北京2011-2017年房价
totalPrice : 总价
price : 按平方计算的平均价格
sec_buildings=pd.read_csv('new.csv',encoding='gbk')
sec_buildings.head()
#北京房价
# 2011-2017年北京房价,来自链家网

# totalPrice : 总价
# price : 按平方计算的平均价格
plt.figure(figsize=(16,9))
plt.boxplot(x=sec_buildings['price'],
            patch_artist=True,showmeans=True,
           showfliers=True,boxprops={'color':'black','facecolor':'steelblue'},
            flierprops={'marker':'o','markerfacecolor':'red','markersize':12},
            meanprops={'marker':'D','markerfacecolor':'indianred','markersize':12},
                      medianprops={'linestyle':'--','color':'orange'})

plt.title('二手房价格箱线图')
plt.show()
4.散点图
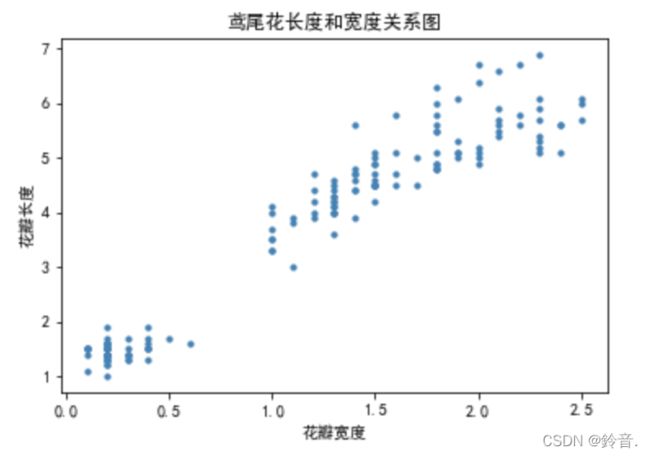
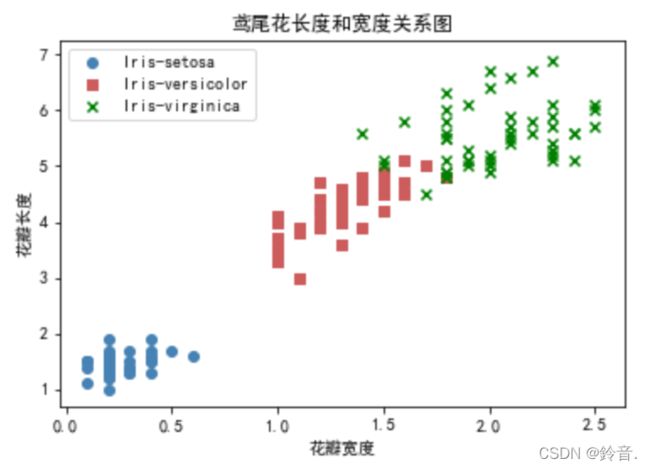
如果要研究两个连续型变量之间的关系,用散点图来展示是最佳的选择,如果要研究不同类别下两个连续型变量的关系,用散点图也是最佳选择
iris=pd.read_csv('IRIS.csv')
plt.scatter(x=iris.petal_width,y=iris.petal_length,s=10,c='steelblue')
plt.xlabel('花瓣宽度')
plt.ylabel('花瓣长度')
plt.title('鸢尾花长度和宽度关系图')
plt.show()
#循环画出不同品种鸢尾花的长度和宽度关系图
colors_iris=['steelblue','indianred','green']
species=['Iris-setosa','Iris-versicolor','Iris-virginica']
marker_iris=['o','s','x']
for i in range(0,3):
    plt.scatter(x=iris.petal_width[iris['species']==species[i]],
               y=iris.petal_length[iris['species']==species[i]],
               color=colors_iris[i],marker=marker_iris[i],label=species[i])
plt.legend(loc='best')
plt.xlabel('花瓣宽度')
plt.ylabel('花瓣长度')
plt.title('鸢尾花长度和宽度关系图')
plt.show()
5.折线图
折线图是将数据点按照顺序连接起来的图形,可以认为主要作用是查看y随着x改变的趋势,非常适合时间序列分析
data=pd.read_excel('国民经济核算季度数据.xlsx')
data
fig=plt.figure(figsize=(8,7))
#'bs--'线条上点的颜色 形状 风格
plt.plot(data.iloc[:,0],data.iloc[:,3],'bs--',
        data.iloc[:,0],data.iloc[:,4],'ro--',
        data.iloc[:,0],data.iloc[:,5],'gH--')
plt.xlabel('年份',fontsize=16)
plt.ylabel('生产总值',fontsize=16)
#刻度,间隔为4 rotation旋转45度
plt.xticks(range(0,70,4),data.iloc[range(0,70,4),1],rotation=45,fontsize=14)
plt.legend(['第一产业','第二产业','第三产业'])
plt.show()
完善统计图形
1.图例和画布使用
图例legend函数使用
legend(loc,bbox_to_anchor,ncol,title,shadow, fancybox)
- loc∶位置(可以使用数字)
- bbox_to_anchor∶该参数是一个4元元组,第一个元素代表距离画布左侧的y轴长度的倍数的距离,第二个元素代表距离画布底部X轴长度的倍数,第三个元素和第四个代表框的长度和和宽度
- frameon:是否要边框
- ncol:图例的排列个数
- title:标题
- shadow:线框是否添加阴影
- fancybox:线框是圆角还是直角
图例legend中loc中的位置和数字关系的使用
best 0
upper right 1
upper left 2
lower left 3
lower right 4
right 5
center left 6
center right 7
fig= plt.figure()# 创建画布
ax=fig.add_axes([a,b,c,d])
该参数是一个4元素列表,第一个元素代表距离最左边的距离,第二个元素代表距离最下面的距离,可以理解为画布,左下角的起点坐标第三个元素和第四个代表画布的长度和和宽度
plt.title(string,family,size,color,style,loc)
string∶标题内容
family∶ 字体类别
size∶ 字体大小
color∶颜色
style∶ 风格
loc∶ 位置
import pandas as pd
import numpy as np
import matplotlib.pyplot as plt
plt.rcParams['font.sans-serif']=['SimHei']
plt.rcParams['axes.unicode_minus']=False
data=pd.read_excel('国民经济核算季度数据.xlsx')

fig=plt.figure(figsize=(8,7))
#'bs--'线条上点的颜色 形状 风格
plt.plot(data.iloc[:,0],data.iloc[:,3],'bs--',
        data.iloc[:,0],data.iloc[:,4],'ro--',
        data.iloc[:,0],data.iloc[:,5],'gH--')
plt.xlabel('年份',fontsize=14)
plt.ylabel('生产总值',fontsize=14)
#刻度,间隔为4 rotation旋转45度
plt.xticks(range(0,70,4),data.iloc[range(0,70,4),1],rotation=45,fontsize=12)
#bbox_to_anchor调整图例距离x,y轴位置位置
#ncol图例顺序,可以试一下不同的值,比如1,2,3
#shadow是否要阴影,用的少
#loc数字与位置的对应看课件,或者输入plt.legend?找
plt.legend(['第一产业','第二产业','第三产业'],
          bbox_to_anchor=(1.3,0.6),ncol=1,title='不同产业的情况',
          shadow=True,loc=0)
plt.title('第三产业增加值',size=24,color='darkblue')
plt.show()
2.调整刻度轴
Prod_Trade=pd.read_excel('非洲通讯产品销售数据.xlsx',sheet_name='SalesData')
Prod_Trade.head()
data_1=Prod_Trade.groupby('日期').mean()
data_1
import matplotlib as mpl
ax=plt.gca()
date_format = mpl.dates.DateFormatter("%Y-%m-%d")
ax.xaxis.set_major_formatter(date_format)#显示为年月日
xlocator=mpl.ticker.LinearLocator(10)
ax.xaxis.set_major_locator(xlocator)#显示有多少个日期
plt.plot(data_1.index,data_1['销售额'],linestyle='-',
        linewidth=2,color='steelblue')
plt.xticks(rotation=45)#旋转45度
plt.xlabel('日期',fontsize=14)
plt.ylabel('销售额',fontsize=14)
plt.title('销售额变化趋势',size=16,color='black')
plt.show()
3.图形添加内容
plt.annotate(string,xy=0),xytext=0,weight=,color=,
arrowprops=dict(arrowstyle=’->’,connection= ‘acr3’,color=))
string;图形内容的注释文本
- xy∶ 被注释图形内容的位置坐标
- xytext∶注释文本的位置坐标
- weight∶注释文本的字体粗细风格
- arrowprop∶指示被注释内容的箭头的属性字典
plt.text(x,y,string,weight,color)
3.1.无指向型注释文本
GDP=pd.read_excel('Province GDP 2017.xlsx')
GDP
plt.figure(figsize=(6.4,4.8))
plt.bar(x=GDP.index.values,height=GDP.GDP,align='center',
       tick_label=GDP.Province,width=0.3)
plt.xticks(rotation=45)
#添加无指向型注释文本,(0,4)表示x的0位置,y的4位置
plt.text(0,4,'GDP最高省份',color='red',fontsize=12)
plt.show()
3.2.有指向型注释文本
plt.figure(figsize=(6.4,4.8))
plt.bar(x=GDP.index.values,height=GDP.GDP,align='center',
       tick_label=GDP.Province,width=0.3)
plt.xticks(rotation=45)
#xy箭头起始坐标 xytext文本起始坐标
plt.annotate('GDP最高省份',xy=(2,8),xytext=(0,4),
            color='b',arrowprops=dict(arrowstyle='->',connectionstyle='arc3',color='red'))
plt.show()
图形样式高级操作
1.绘制双坐标轴
在数据分析中,很多时候,由于变量之间量纲级不一样,如果绘制在同一个坐标轴上,可以量纲级较小的变量就很难看出变化趋势,所以需要绘制双坐标轴,来显示两个变量的趋势
data=pd.read_excel('非洲通讯产品销售数据.xlsx',sheet_name='SalesData')
data.head()
data_1=data.groupby('地区').mean()
data_1
fig=plt.figure()
ax1=fig.add_subplot(111)
ax1.plot(data_1.index,data_1.销售额,label='销售额',color='green')
ax1.set_ylabel('不同地区销售额情况')
plt.legend(loc='upper left')
#twins双胞胎,两个坐标轴
ax2=ax1.twinx()
ax2.plot(data_1.index,data_1.利润,color='red',label='利润')
plt.legend(loc='upper center')
plt.show()
2.多个图形合并
2.1.subplot()
GDP_data=pd.read_excel('国民经济核算季度数据.xlsx')
GDP=pd.read_excel('Province GDP 2017.xlsx')
Titanic=pd.read_csv('titanic_train.csv')
Titanic.dropna(subset=['Age'],inplace=True)
plt.figure(figsize=(16,9))
plt.subplot(121)#一行两列
plt.plot(GDP_data['序号'],GDP_data['国内生产总值_当季值(亿元)'],c='c')
plt.xlabel('季度',fontsize=12)
plt.ylabel('GDP',fontsize=18)
plt.xticks(range(0,70,4),GDP_data.iloc[range(0,70,4),1],rotation=45)
plt.subplot(122)
plt.bar(x=GDP.Province,height=GDP.GDP,color='r')
plt.xticks(fontsize=16)
plt.show()
2.2.subplot2grid()
subplot2grid函数可以让子区跨越固定的网格布局的多个行和列,实现不同的子区布局
plt.subplot2grid(shape,loc,colspan,rowspan)参数
- shape∶网格布局
- loc∶表示图形的位置起点
- colspan∶跨越的列数
- rowspan∶跨越的行数
plt.figure(figsize=(16,9))
plt.subplot2grid((2,3),(0,0),colspan=1,rowspan=2)
plt.plot(GDP_data['序号'],GDP_data['国内生产总值_当季值(亿元)'],c='c')
plt.xlabel('季度',fontsize=12)
plt.ylabel('GDP',fontsize=18)
plt.xticks(range(0,70,4),GDP_data.iloc[range(0,70,4),1],rotation=45)

plt.subplot2grid((2,3),(0,1),colspan=2,rowspan=1)
plt.bar(x=GDP.Province,height=GDP.GDP,color='c')
plt.xticks('rotation=45')

plt.subplot2grid((2,3),(1,1),colspan=2,rowspan=1)
plt.hist(x=Titanic['Age'],bins=20,color='c',density=True)
plt.suptitle('不同图形展示',size=20)
plt.show()
Seaborn基础
- seaborn是在matplotlib发展的,使得作图更加容易
- 容易绘制更加精致的图形
- 兼容pandas和numpy等数据结构
使用seaborn绘制图 形,有 三种方式,分别如下:
- plt.style.use( ‘seaborn’)
- sns.set()
- 调用seaborn函数
- 但对于简单的制图,使用前两种都可以,但对于复杂图形,可能会使用第三种方式
import pandas as pd
import numpy as np
import os
import seaborn as sns
import matplotlib.pyplot as plt
GDP=pd.read_excel('Province GDP 2017.xlsx')
plt.style.use('seaborn')
plt.rcParams['font.sans-serif']=['SimHei']#解决中文乱码
plt.rcParams['axes.unicode_minus']=False#解决符号乱码
#GDP.index.values数组结构,GDP.index Series结构,两种结构都支持
plt.bar(x=GDP.index.values,height=GDP.GDP,tick_label=GDP.Province,
       color='steelblue')
plt.ylabel('GDP(万亿)')
plt.show()
#style主题样式 context控制元素缩放font_scale控制坐标轴刻度大小
sns.set(style='darkgrid',context='notebook',font_scale=1.2)
plt.rcParams['font.sans-serif']=['SimHei']#解决中文乱码
plt.rcParams['axes.unicode_minus']=False#解决符号乱码
#GDP.index.values数组结构,GDP.index Series结构,两种结构都支持
plt.bar(x=GDP.index.values,height=GDP.GDP,tick_label=GDP.Province,
       color='steelblue')
plt.ylabel('GDP(万亿)')
plt.show()
#orient朝向
sns.barplot(x='Province',y='GDP',data=GDP,color='steelblue',
           orient='vertical')
#显示数值
for x,y in enumerate(GDP.GDP):
    plt.text(x,y+0.1,'%s万亿'%round(y,1),ha='center',fontsize=12)
plt.show()
#orient朝向
sns.barplot(x='GDP',y='Province',data=GDP,color='steelblue',
           orient='h')
plt.show()
![]()
绘制常用统计图形
sns.barplot(x,y):柱状图
绘制柱状图语法 如下∶
sns.barplot(x=‘Quarter’,y ='GDP,hue=‘IndustryType, data=Industry.GDP,color=blue’,palette=“husl”,orient =‘vertical’)
- x,y不同坐标上的值
- hue:分类变量
- data数据
- color:颜色
- Palette∶调色板
- orient∶方向(vertical∶垂直,horizontal∶水平)
import numpy as np
import pandas as pd
import seaborn as sns
import matplotlib.pyplot as plt
Industry_GDP=pd.read_excel('Industry_GDP.xlsx')
plt.rcParams['font.sans-serif']=['SimHei']#解决中文乱码
plt.rcParams['axes.unicode_minus']=False#解决符号乱码
sns.barplot(x='Quarter',y='GDP',hue='Industry_Type',
           data=Industry_GDP,palette='husl',orient='v')
#bbox_to_anchor图例位置 frameon是否有边框
plt.legend(loc='best',bbox_to_anchor=(1.01,0.85),frameon=False)
plt.show()
sns.scatter(x,y):散点图
sns.scatterplot(x,y,hue,data,color,palette,style,s,markers)
- x,y不同坐标上的值
- hue∶分类变量
- data∶数据
- color∶颜色
- palette∶调色板
- style∶以分类变量作图,产生不同的形状
- s∶形状大小
- markers∶形状
iris=pd.read_csv('IRIS.csv')
#style以分类变量作图,产生不同形状的点
#hue以什么分类
sns.scatterplot(x='petal_width',y='petal_length',data=iris,
            color='red',s=20,hue='species',style='species')
plt.xlabel('花瓣宽度')
plt.ylabel('花瓣长度')
plt.show()
sns.barplot:箱线图
sns.boxplot(x,y,hue,data,order,width, fliersize,linewidth, color,palette)
- x,y不同坐标上的值
- hue∶分类变量
- data∶数据
- widh∶箱线宽度
- fliersize∶异常值点的大小
- color∶ 颜色
- Palete∶调色板
- linewidth∶指定箱体边框的宽度
Titanic=pd.read_csv('titanic_train.csv')
Titanic.dropna(subset=['Age'],inplace=True)
sns.boxplot(y='Age',data=Titanic,
           showmeans=True,color='steelblue',width=0.3,
           flierprops={'markerfacecolor':'indianred','markersize':3},#异常值  填充色indianred印度红
           meanprops={'marker':'D','markersize':4},#均值
           medianprops={'linestyle':'--','color':'orange'})#中位数
plt.ylabel('年龄',fontsize=14)
plt.show()
sec_building=pd.read_csv('new.csv',encoding='gbk')
group_region=sec_building.groupby('district')
avg_price=group_region.agg({'price':np.mean})
avg_price=avg_price.sort_values('price',ascending=False)
# plt.figure(figsize=(12,8))
sns.boxplot(x='district',y='price',data=sec_building,
           order=avg_price.index,showmeans=True,color='steelblue',width=0.3,
           flierprops={'markerfacecolor':'indianred','markersize':3},#异常值  填充色indianred印度红
           meanprops={'marker':'D','markersize':4},#均值
           medianprops={'linestyle':'--','color':'orange'})#中位数
plt.ylabel('单价(元)')
plt.title('不同地区二手房对比')
plt.show()
sns.distplot,sns.displot:直方图
sns.distplot(a,bin,hist,kde,rug,fit,hist_kws,kde_kws,fit_kws,color,norm_hisr,ax)
- a∶数据
- bin∶ 直方条形个数
- hist∶∶是否绘制直方图
- kde∶是否绘制核密度图f
- fit∶是否绘制概率密度曲线图
- hist_kws∶传递直方图相关参数
- kde_kws∶传递核密度图相关参数
- fit_kws 传递概率密度曲线相关参数
- color∶曲线颜色
- norm_hist∶是否将频数改成频率
- ax:指定子图位置
官方文档distplot()
官方文档displot()
Titanic=pd.read_csv('titanic_train.csv')
Age_Male=Titanic[Titanic.Sex=='male']['Age']
Age_Female=Titanic[Titanic.Sex=='female']['Age']
Titanic=Titanic.dropna(subset=['Age'])
from scipy.stats import norm
plt.rcParams['font.sans-serif']=['SimHei']#解决中文乱码
plt.rcParams['axes.unicode_minus']=False#解决符号乱码
#norm_hist=True以频率形式展现出来
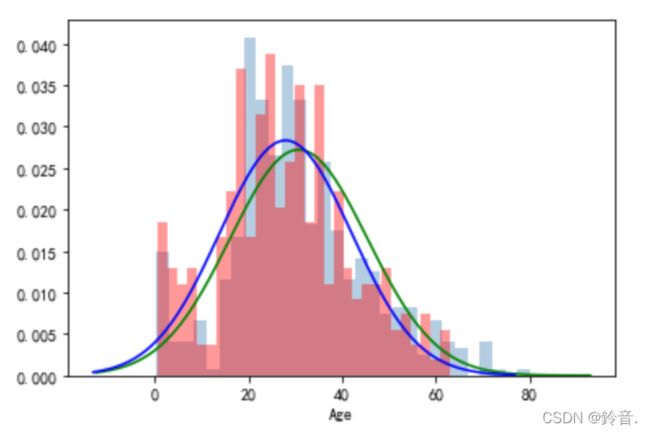
sns.distplot(Age_Male,bins=30,kde=False,hist_kws={'color':'steelblue'},norm_hist=True,label='男性')
sns.distplot(Age_Male,hist=False,kde=False,fit=norm,fit_kws={'color':'g'},norm_hist=True,label='男性正态分布图')
plt.rcParams['font.sans-serif']=['SimHei']
plt.rcParams['axes.unicode_minus']=False
sns.distplot(Age_Female,bins=30,kde=False,hist_kws={'color':'red'},norm_hist=True,label='女性')
sns.distplot(Age_Female,hist=False,kde=False,fit=norm,fit_kws={'color':'b'},norm_hist=True,label='女性正态分布图')
plt.show()
其他参数和图形
1.折线图
income_data=pd.read_csv('data.csv')
income_data['year']=range(1994,2014,1)
#style  ticks带有坐标轴  darkgrid灰白加网格
sns.set(style='ticks',context='notebook')
plt.rcParams['font.sans-serif']=['SimHei']
plt.rcParams['axes.unicode_minus']=False
sns.lineplot(x='year',y='y',data=income_data,lw=2,color='red')
plt.xticks(range(1994,2014,1),range(1994,2014,1),rotation=45)
plt.show()
2.回归图
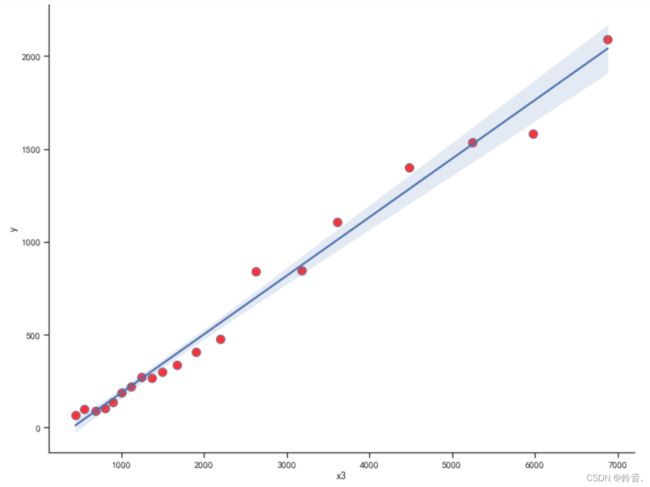
常用于展示某两种变量之间是否有线性关系
#fit_reg是否拟合
sns.lmplot(x='x3',y='y',data=income_data,legend_out=False,
          markers='o',fit_reg=True,aspect=1.3,height=8,
          scatter_kws={'s':100,'facecolor':'red'})
plt.show()
3.条形图
Prod_Trade=pd.read_excel('非洲通讯产品销售数据.xlsx',sheet_name='SalesData')
sns.countplot(x='地区',data=Prod_Trade,hue='服务分类')
plt.show()
#style可选dark whitegrid white ticks
#font_scale坐标轴刻度缩放
#palette可为colorblind deep bright pastel dark
sns.set(style='darkgrid',context='notebook',font_scale=1.2,palette='dark')
plt.rcParams['font.sans-serif']=['SimHei']
plt.rcParams['axes.unicode_minus']=False
sns.countplot(x='地区',data=Prod_Trade,hue='服务分类')
plt.show()
Plotly介绍和基础
介绍
- plotly是一个基于JavaScript的绘图库,plotly绘图种类丰富,效果美观
- 易于保存与分享plotly的绘图结果可以与Web无缝集成
- plotly默认的绘图结果是一个HTML网页文件,通过浏览器可以查看
本次课程使用的是Plotly离线绘图库,并把数据保存在本地
-
使用plotly.offline.plot和plotly.offline.iplot()
-
使用plotly.offline.plot方法会在本地新建一个HTML文件,并可以选择是否在浏览器中打开这个文件
-
使用plotly.offline.iplot()方法会在Jupyter Notebook中直接绘图
plotly绘图命令
在真实项目中,使用plotly绘图模块进行绘图的完整流程包括∶
- 添加图轨数据,例如使用Scatter函数
- 设置画图布局,使用layout命令
- 集成图形、布局数据
- 绘制图形的输出,命令是ofline.plot
import plotly as py
import plotly.graph_objs as go
from plotly.graph_objs import Scatter
#py.offline.init_notebook_mode()#初始化
#绘图对象
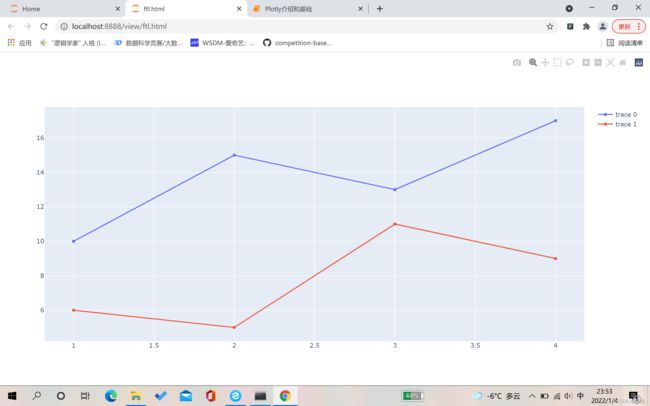
trace0=Scatter(x=[1,2,3,4],y=[10,15,13,17])
trace1=Scatter(x=[1,2,3,4],y=[6,5,11,9])
data=[trace0,trace1]
py.offline.plot(data,filename='ftl.html')#生成文件
py.offline.iplot(data,filename='ftl.html')#在线
常见图形绘制
1.散点图
基本语法:
go.Scatter(x,y,mode,name,marker,line)
- x–数据
- y–数据
- mode—线条类型
- name—图例名称
- marker—控制点的相关参数
布局控制
go.Layout(title,xaxis,yaxis)
- title–标题
- xaxis–控制x轴参数
- yaxis --控制y轴参数
income_tax=pd.read_excel('income_tax.xlsx')
pyplot=py.offline.iplot
#添加绘图数据
trace1=Scatter(x=income_tax['year'],y=income_tax['x2'],mode='markers',name='在职员工工资总收入')
trace2=Scatter(x=income_tax['year'],y=income_tax['x3'],mode='lines',name='社会消费品零售总额')
trace3=Scatter(x=income_tax['year'],y=income_tax['x8'],mode='markers+lines',name='地区生产总值')
data=[trace1,trace2,trace3]
pyplot(data)
2.折线图
trace1=Scatter(y=income_tax['x8'],x=income_tax['y'],name='地区生产总值和财政收入关系',
              mode='lines',line=dict(width=2,color='green'))
trace2=Scatter(y=income_tax['x3'],x=income_tax['y'],name='社会消费品零售总额和财政收入关系',
              mode='lines',line=dict(width=2,color='blue'))
data=[trace1,trace2]
layout=go.Layout(title='财政收入变化',xaxis=dict(title='地区生产总值'),
                yaxis=dict(title='财政收入'),legend=dict(x=1,y=0.5,font=dict(size=12,color='black')))
fig=go.Figure(data=data,layout=layout)
pyplot(fig)
3.柱状图
Prod_Trade=pd.read_excel('非洲通讯产品销售数据.xlsx',sheet_name='SalesData')
order_Region=Prod_Trade['地区'].value_counts()
trace_basic=go.Bar(x=order_Region.index.tolist(),y=order_Region.values.tolist(),marker=dict(color=['red','blue','green','darkgrey','darkblue'],opacity=0.39))#opacity透明度
layout=go.Layout(title='不同地区数量',xaxis=dict(title='地区'))
figure_basic=go.Figure(data=trace_basic,layout=layout)
pyplot(figure_basic)
Industry_GDP=pd.read_excel('Industry_GDP.xlsx')
G1=Industry_GDP[Industry_GDP['Industry_Type']=='第一产业']
G2=Industry_GDP[Industry_GDP['Industry_Type']=='第二产业']
G3=Industry_GDP[Industry_GDP['Industry_Type']=='第三产业']
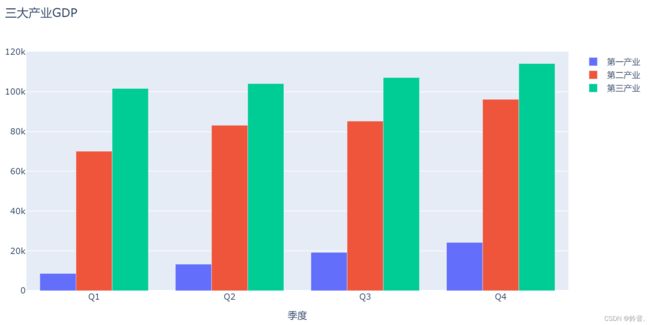
trace1=go.Bar(x=G1.Quarter,y=G1['GDP'],name='第一产业')
trace2=go.Bar(x=G2.Quarter,y=G2['GDP'],name='第二产业')
trace3=go.Bar(x=G3.Quarter,y=G3['GDP'],name='第三产业')
trace=[trace1,trace2,trace3]
layout=go.Layout(title='三大产业GDP',xaxis=dict(title='季度'))
figure=go.Figure(data=trace,layout=layout)
pyplot(figure)
#barmode='stack'堆叠
layout=go.Layout(title='三大产业GDP',xaxis=dict(title='季度'),barmode='stack')
figure=go.Figure(data=trace,layout=layout)
pyplot(figure)
4.直方图
Titanic=pd.read_csv('titanic_train.csv')
data=[go.Histogram(x=Titanic['Age'],histnorm='probability',marker=dict(color='blue'))]
pyplot(data)
5.饼图
#hole=0.2空心圆半径占整个圆半径的0.5
trace=[go.Pie(labels=order_Region.index.tolist(),values=order_Region.values.tolist(),hole=0.5,textfont=dict(size=12,color='white'))]
layout=go.Layout(title='不同地区的销售情况')
fig=go.Figure(data=trace,layout=layout)
pyplot(fig)
图形设置
pyplot=py.offline.iplot
Prod_Trade=pd.read_excel('非洲通讯产品销售数据.xlsx',sheet_name='SalesData')
order_Region=Prod_Trade['地区'].value_counts()
mean_value=order_Region.values.mean()
y=np.tile(mean_value,5)
trace_basic=go.Bar(x=order_Region.index.tolist(),y=order_Region.values.tolist(),marker=dict(color=['red','blue','green','steelblue','orange']),opacity=0.5)
trace_average=go.Scatter(x=order_Region.index.tolist(),y=y,mode='lines',name='均值')
data=[trace_basic,trace_average]
layout=go.Layout(title='不同地区数量',xaxis=dict(title='地区'))
figure_basic=go.Figure(data=data,layout=layout)
pyplot(figure_basic)
income_tax=pd.read_excel('income_tax.xlsx')
#添加绘图数据
trace1=Scatter(x=income_tax['y'],y=income_tax['x8'],mode='markers',name='地区生产总值和财政收入关系')
trace2=Scatter(x=income_tax['y'],y=income_tax['x10'],mode='lines',name='税收和财政收入关系',yaxis='y2')
data=[trace1,trace2]
layout=go.Layout(title='财政收入变化',xaxis=dict(title='财政收入'),
                yaxis=dict(title='地区生产总值'),yaxis2=dict(title='税收收入',overlaying='y',side='right'),
                legend=dict(x=0.1,y=0.9,font=dict(size=12,color='black')))
fig=go.Figure(data=data,layout=layout)
pyplot(fig)
Prod_Trade=pd.read_excel('非洲通讯产品销售数据.xlsx',sheet_name='SalesData')
order_Region=Prod_Trade['地区'].value_counts()
order_type=Prod_Trade['服务分类'].value_counts()
from plotly import tools
fig=tools.make_subplots(rows=2,cols=1)
trace1=go.Bar(x=order_Region.index.tolist(),y=order_Region.values.tolist(),marker=dict(color=['red','blue','green','steelblue','orange']),opacity=0.5,name='不同地区订单')
trace2=go.Bar(x=order_type.index.tolist(),y=order_Region.values.tolist(),marker=dict(color=['red','blue','green','steelblue','orange']),opacity=0.5,name='不同服务分类订单')
fig.append_trace(trace1,1,1)
fig.append_trace(trace2,2,1)
fig['layout'].update(height=600,width=600,title='不同订单')
pyplot(fig)


