scipy.optimize.curve_fit函数用法解析
scipy.optimize.curve_fit函数用法解析
转:https://zhuanlan.zhihu.com/p/144353126
optimize.curve_fit()函数,用于日常数据分析中的数据曲线拟合。
语法:scipy.optimize.curve_fit(f,xdata,ydata,p0=None,sigma=None,absolute_sigma=False,check_finite=True,bounds=(-inf,inf),method=None,jac=None,**kwargs)
参数解析:
(官方文档说明:https://docs.scipy.org/doc/scipy/reference/generated/scipy.optimize.curve_fit.html#scipy-optimize-curve-fit)
- f 函数名
callable
The model function, f(x, …). It must take the independent variable as the first argument and the parameters to fit as separate remaining arguments.
简单来说就是需要拟合的函数y,包括自变量x,参数A,B;
而curve_fit的主要功能就是计算A,B
#要拟合的一次函数
def f_1(x, A, B):
return A * x + B- xdata
array_like or object
The independent variable where the data is measured. Should usually be an M-length sequence or an (k,M)-shaped array for functions with k predictors, but can actually be any object.
简单说就是要拟合的自变量数组 - ydata
array_like
The dependent data, a length M array - nominallyf(xdata,...)
简单说就是要拟合的因变量的值 - p0
array_like , optional
Initial guess for the parameters (length N). If None, then the initial values will all be 1 (if the number of parameters for the function can be determined using introspection, otherwise a ValueError is raised).
就是给你的函数的参数确定一个初始值来减少计算机的计算量
其它的参数均不再说明!
返回值解析
- popt array
Optimal values for the parameters so that the sum of the squared residuals off(xdata,*popt)-ydatais minimized
即残差最小时参数的值 - pcov 2d array
The estimated covariance of popt. The diagonals provide the variance of the parameter estimate. To compute one standard deviation errors on the parameters useperr=np.sqrt(np.diag(pcov)).
How the sigma parameter affects the estimated covariance depends on absolute_sigma argument, as described above.
If the Jacobian matrix at the solution doesn’t have a full rank, then ‘lm’ method returns a matrix filled with np.inf, on the other hand ‘trf’ and ‘dogbox’ methods use Moore-Penrose pseudoinverse to compute the covariance matrix.
简单例子
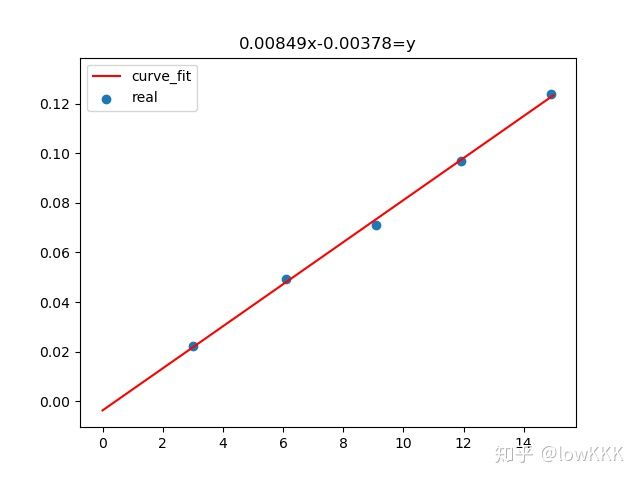
- 例子1:拟合直线
# 引用库函数
import pandas as pd
import numpy as np
import matplotlib.pyplot as plt
from scipy import optimize as op

# 需要拟合的数据组
x_group = np.array([3, 6.1, 9.1, 11.9, 14.9])
y_group = np.array([0.0221, 0.0491, 0.0711, 0.0971, 0.1238])


# 需要拟合的函数
def f_1(x, A, B):
    return A * x + B


# 得到返回的A,B值
A, B = op.curve_fit(f_1, x_group, y_group)[0]
# 数据点与原先的进行画图比较
plt.scatter(x_group, y_group, marker='o',label='real')
x = np.arange(0, 15, 0.01)
y = A * x + B
plt.plot(x, y,color='red',label='curve_fit')
plt.legend()
plt.title('%.5fx%.5f=y' % (A, B))
plt.show()- 例子2:官方例子[1]
import matplotlib.pyplot as plt
from scipy.optimize import curve_fit
import numpy as np


# 定义需要拟合的函数
def func(x, a, b, c):
    return a * np.exp(-b * x) + c


# Define the data to be fit with some noise:
# 用numpy的random库生成干扰
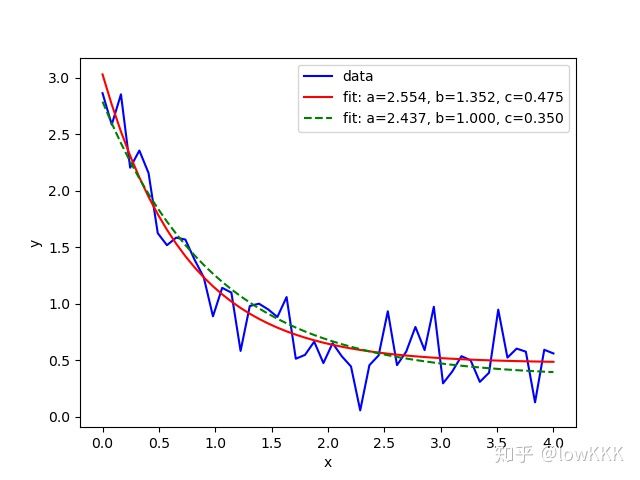
xdata = np.linspace(0, 4, 50)
y = func(xdata, 2.5, 1.3, 0.5)
np.random.seed(1729)
y_noise = 0.2 * np.random.normal(size=xdata.size)
ydata = y + y_noise
plt.plot(xdata, ydata, 'b-', label='data')
# Fit for the parameters a, b, c of the function func:

popt, pcov = curve_fit(func, xdata, ydata)
print(popt)

plt.plot(xdata, func(xdata, *popt), 'r-',
         label='fit: a=%5.3f, b=%5.3f, c=%5.3f' % tuple(popt))
# Constrain the optimization to the region of 0 <= a <= 3, 0 <= b <= 1 and 0 <= c <= 0.5:
# 限定范围进行拟合
popt, pcov = curve_fit(func, xdata, ydata, bounds=(0, [3., 1., 0.5]))
print(popt)

plt.plot(xdata, func(xdata, *popt), 'g--',
         label='fit: a=%5.3f, b=%5.3f, c=%5.3f' % tuple(popt))
plt.xlabel('x')
plt.ylabel('y')
plt.legend()
plt.show()
#结果
#[2.55423706 1.35190947 0.47450618]
#[2.43708905 1.         0.35015434]
参考
- scipy.optimize官方文档 https://docs.scipy.org/doc/scipy/reference/generated/scipy.optimize.curve_fit.html#scipy-optimize-curve-fit

