pandas学习笔记(五):数据特征分析与pandas优化
注:学习笔记基于文彤老师的pandas的系列课程
课程链接:https://study.163.com/course/courseMain.htm?courseId=1005124008&share=1&shareId=1146477588
# 设定系统环境
import pandas as pd
pd.options.display.max_rows = 10 # 设定自由列表输出最多为10行
pd.__version__ # 显示当前Pandas版本号,默认输出最后一行内容(即使没有打印输出)
'1.1.0'
df2 = pd.read_csv("univ.csv", encoding ="GBK")#使用英文名称,否则可能会报错
#把文件放到了该目录下,因此不需要再写路径,注意编码要写
df2
| 名次 | 学校名称 | 总分 | 类型 | 所在省份 | 所在城市 | 办学方向 | 主管部门 | |
|---|---|---|---|---|---|---|---|---|
| 0 | 1 | 北京大学 | 100.00 | 综合 | 北京 | 北京市 | 中国研究型 | 教育部 |
| 1 | 2 | 清华大学 | 98.50 | 理工 | 北京 | 北京市 | 中国研究型 | 教育部 |
| 2 | 3 | 复旦大学 | 82.79 | 综合 | 上海 | 上海市 | 中国研究型 | 教育部 |
| 3 | 4 | 武汉大学 | 82.43 | 综合 | 湖北 | 武汉市 | 中国研究型 | 教育部 |
| 4 | 5 | 浙江大学 | 82.38 | 综合 | 浙江 | 杭州市 | 中国研究型 | 教育部 |
| ... | ... | ... | ... | ... | ... | ... | ... | ... |
| 95 | 96 | 浙江师范大学 | 63.37 | 师范 | 浙江 | 金华市 | 区域特色研究型 | 浙江省 |
| 96 | 97 | 安徽大学 | 63.34 | 综合 | 安徽 | 合肥市 | 区域研究型 | 安徽省 |
| 97 | 98 | 首都医科大学 | 63.32 | 医药 | 北京 | 北京市 | 区域特色研究型 | 北京市 |
| 98 | 99 | 江南大学 | 63.31 | 综合 | 江苏 | 无锡市 | 区域特色研究型 | 教育部 |
| 99 | 100 | 山西大学 | 63.29 | 综合 | 山西 | 太原市 | 区域研究型 | 山西省 |
100 rows × 8 columns
1. 数据特征的分析探索
1.1 数值变量的基本描述
df.describe(
percentiles : 需要输出的百分位数,列表格式提供,如[.25, .5, .75]
include = ‘None’ : 要求纳入分析的变量类型白名单
None (default) : 只纳入数值变量列
A list-like of dtypes : 列表格式提供希望纳入的类型
‘all’ : 全部纳入
exclude : 要求剔除出分析的变量类型黑名单,选项同上
)
df2.describe()
| 名次 | 总分 | |
|---|---|---|
| count | 100.000000 | 100.000000 |
| mean | 50.410000 | 68.506100 |
| std | 28.965704 | 6.766652 |
| min | 1.000000 | 63.290000 |
| 25% | 25.750000 | 64.387500 |
| 50% | 50.500000 | 65.690000 |
| 75% | 75.250000 | 69.807500 |
| max | 100.000000 | 100.000000 |
1.2 分类变量的频数统计
Series.value_counts(
normalize = False : 是否返回构成比而不是原始频数
sort = True : 是否按照频数排序(否则按照原始顺序排列)
ascending = False : 是否升序排列
bins : 对数值变量直接进行分段,可看作是pd.cut的简便用法
dropna = True : 结果中是否包括NaN
)
value_counts是一个序列的函数,但是可以直接用pandas调用
前序列。括号不用加序列
前pd,括号需要加序列
pd.value_counts(df2.类型)
理工    39
综合    32
师范    11
农林     6
医药     5
财经     5
政法     1
民族     1
Name: 类型, dtype: int64
df2.类型.value_counts()
理工    39
综合    32
师范    11
农林     6
医药     5
财经     5
政法     1
民族     1
Name: 类型, dtype: int64
df2.总分.value_counts(bins = 10)
(63.252, 66.961]    64
(66.961, 70.632]    12
(70.632, 74.303]     8
(74.303, 77.974]     7
(81.645, 85.316]     5
(96.329, 100.0]      2
(77.974, 81.645]     2
(92.658, 96.329]     0
(88.987, 92.658]     0
(85.316, 88.987]     0
Name: 总分, dtype: int64
1.3交叉表/数据透视表
数据透视,对多个分类变量进行描述
下面一个是df. 一个是pd. 若是pd 则要指定是哪一个表的哪个变量
df.pivot_table(
行列设定
index / columns : 行变量/列变量,多个时以list形式提供
单元格设定
values : 在单元格中需要汇总的变量列,可不写
aggfunc = numpy.mean : 相应的汇总函数
汇总设定
margins = False : 是否加入行列汇总
margins_name = ‘All’ : 汇总行/列的名称
缺失值处理
fill_value = None : 用于替换缺失值的数值
dropna = True :
)
pd.crosstab(
选项和pivot_table几乎相同
相对而言需要打更多字母,因此使用更麻烦
但是计算频数最方便
输出格式为数据框
行列设定
index / columns : 行变量/列变量,多个时以list形式提供
rownames / colnames = None : 交叉表的行列名称
单元格设定
values : 在单元格中需要汇总的变量列,需要进一步指定aggfunc
aggfunc : 相应的汇总函数
汇总设定
margins = False : 是否加入行列汇总
margins_name = ‘All’ : 汇总行/列的名称
dropna = True :
)
df2.pivot_table(index = ['所在省份', '主管部门'],
           columns = '类型', values = '总分', aggfunc = sum)
| 类型 | 农林 | 医药 | 师范 | 政法 | 民族 | 理工 | 综合 | 财经 | |
|---|---|---|---|---|---|---|---|---|---|
| 所在省份 | 主管部门 | ||||||||
| 上海 | NaN | 64.74 | NaN | NaN | NaN | NaN | NaN | NaN | |
| 上海市 | NaN | NaN | NaN | NaN | NaN | NaN | 64.41 | NaN | |
| 教育部 | NaN | NaN | 69.52 | NaN | NaN | 202.88 | 164.55 | 64.96 | |
| 云南 | 云南省 | NaN | NaN | NaN | NaN | NaN | NaN | 65.11 | NaN |
| 北京 | 北京市 | NaN | 63.32 | 63.73 | NaN | NaN | 63.89 | NaN | NaN |
| ... | ... | ... | ... | ... | ... | ... | ... | ... | ... |
| 陕西 | NaN | 64.51 | NaN | NaN | NaN | NaN | NaN | NaN | |
| 工业和信息化部 | NaN | NaN | NaN | NaN | NaN | 67.77 | NaN | NaN | |
| 教育部 | 64.92 | NaN | 63.88 | NaN | NaN | 130.90 | 73.56 | NaN | |
| 陕西省 | NaN | NaN | NaN | NaN | NaN | NaN | 65.88 | NaN | |
| 黑龙江 | 工业和信息化部 | NaN | NaN | NaN | NaN | NaN | 138.13 | NaN | NaN |
46 rows × 8 columns
pd.crosstab([df2['所在省份'], df2.主管部门],
            df2.类型, values = df2.总分, aggfunc = sum)
| 类型 | 农林 | 医药 | 师范 | 政法 | 民族 | 理工 | 综合 | 财经 | |
|---|---|---|---|---|---|---|---|---|---|
| 所在省份 | 主管部门 | ||||||||
| 上海 | NaN | 64.74 | NaN | NaN | NaN | NaN | NaN | NaN | |
| 上海市 | NaN | NaN | NaN | NaN | NaN | NaN | 64.41 | NaN | |
| 教育部 | NaN | NaN | 69.52 | NaN | NaN | 202.88 | 164.55 | 64.96 | |
| 云南 | 云南省 | NaN | NaN | NaN | NaN | NaN | NaN | 65.11 | NaN |
| 北京 | 北京市 | NaN | 63.32 | 63.73 | NaN | NaN | 63.89 | NaN | NaN |
| ... | ... | ... | ... | ... | ... | ... | ... | ... | ... |
| 陕西 | NaN | 64.51 | NaN | NaN | NaN | NaN | NaN | NaN | |
| 工业和信息化部 | NaN | NaN | NaN | NaN | NaN | 67.77 | NaN | NaN | |
| 教育部 | 64.92 | NaN | 63.88 | NaN | NaN | 130.90 | 73.56 | NaN | |
| 陕西省 | NaN | NaN | NaN | NaN | NaN | NaN | 65.88 | NaN | |
| 黑龙江 | 工业和信息化部 | NaN | NaN | NaN | NaN | NaN | 138.13 | NaN | NaN |
46 rows × 8 columns
1.4常用的假设检验方法
相关命令集中在scipy.stats包中,Pandas目前并未考虑做进一步整合,因此仍然需要从Pandas中提取出相应的序列,然后再进行检验
更复杂的分析方法可以在statsmodels中实现,而且statsmodels和Pandas高度整合,直接使用Pandas作为其底层数据结构。
单样本t检验
ss.ttest_1samp(a, popmean[, axis])
两独立样本t检验
ss.ttest_ind(a, b[, axis, equal_var])
配对t检验
ss.ttest_rel(a, b[, axis])
单因素方差分析
ss.f_oneway()
卡方检验
ss.chisquare(f_obs[, f_exp, ddof, axis]) : 单样本卡方
ss.chi2_contingency(observed) : 列联表卡方
相关分析
ss.pearsonr(x,y)
回归分析
ss.linregress(x,y)
非参数检验方法
kstest(rvs, cdf[, args, N, alternative, mode])
Perform the Kolmogorov-Smirnov test for goodness of fit.
ks_2samp(data1, data2)
Computes the Kolmogorov-Smirnov statistic on 2 samples.
rankdata(a[, method])
Assign ranks to data, dealing with ties appropriately.
mannwhitneyu(x, y[, use_continuity])
Computes the Mann-Whitney rank test on samples x and y.
tiecorrect(rankvals)
Tie correction factor for ties in the Mann-Whitney U
and Kruskal-Wallis H tests.
ranksums(x, y)
Compute the Wilcoxon rank-sum statistic for two samples.
wilcoxon(x[, y, zero_method, correction])
Calculate the Wilcoxon signed-rank test.
kruskal(*args)
Compute the Kruskal-Wallis H-test for independent samples
friedmanchisquare(*args)
Computes the Friedman test for repeated measurements
from scipy import stats as ss
# t 检验
ss.ttest_ind(df2.名次, df2.总分) # 各组分别占一列
Ttest_indResult(statistic=-6.083626293702289, pvalue=5.966498524498979e-09)
# ANOVA
ss.f_oneway(df2.名次, df2.总分) # 各组分别占一列
F_onewayResult(statistic=37.01050888142585, pvalue=5.966498524499011e-09)
# 卡方检验
ss.chisquare(df2.类型.value_counts())
Power_divergenceResult(statistic=120.32, pvalue=6.571360136858322e-23)
# 相关系数
ss.pearsonr(df2.名次, df2.总分)
(-0.793031011049869, 8.101456041566422e-23)
# 简单线性回归
ss.linregress(df2.名次, df2.总分)
LinregressResult(slope=-0.1852592629691078, intercept=77.84501944627273, rvalue=-0.7930310110498688, pvalue=8.101456041566526e-23, stderr=0.014375510065991479)
实战:分析PM2.5数据
基于前面数据整理实战中的成果,要求:
给出分年度的数据基本描述
给出分月份的数据基本描述
按照年月交叉,给出PM2.5的最大值
bj.groupby('Year').describe()
| Month | Day | ... | Hour | Value | |||||||||||||||||
|---|---|---|---|---|---|---|---|---|---|---|---|---|---|---|---|---|---|---|---|---|---|
| count | mean | std | min | 25% | 50% | 75% | max | count | mean | ... | 75% | max | count | mean | std | min | 25% | 50% | 75% | max | |
| Year | |||||||||||||||||||||
| 2008 | 5087.0 | 7.222725 | 2.019403 | 4.0 | 5.0 | 7.0 | 9.0 | 11.0 | 5087.0 | 15.873403 | ... | 17.50 | 23.0 | 5087.0 | 28.405937 | 248.882013 | -999.0 | 32.0 | 66.0 | 119.0 | 610.0 |
| 2009 | 8760.0 | 6.526027 | 3.448048 | 1.0 | 4.0 | 7.0 | 10.0 | 12.0 | 8760.0 | 15.720548 | ... | 17.25 | 23.0 | 8760.0 | -147.127626 | 466.460213 | -999.0 | 11.0 | 58.0 | 118.0 | 712.0 |
| 2010 | 8760.0 | 6.526027 | 3.448048 | 1.0 | 4.0 | 7.0 | 10.0 | 12.0 | 8760.0 | 15.720548 | ... | 17.25 | 23.0 | 8760.0 | 19.806279 | 306.102714 | -999.0 | 26.0 | 71.0 | 139.0 | 980.0 |
| 2011 | 8760.0 | 6.526027 | 3.448048 | 1.0 | 4.0 | 7.0 | 10.0 | 12.0 | 8760.0 | 15.720548 | ... | 17.25 | 23.0 | 8760.0 | 7.961530 | 315.760516 | -999.0 | 21.0 | 61.0 | 129.0 | 595.0 |
| 2012 | 8784.0 | 6.513661 | 3.451430 | 1.0 | 4.0 | 7.0 | 10.0 | 12.0 | 8784.0 | 15.756831 | ... | 17.25 | 23.0 | 8784.0 | 29.864185 | 262.139746 | -999.0 | 20.0 | 63.0 | 128.0 | 994.0 |
| 2013 | 8760.0 | 6.526027 | 3.448048 | 1.0 | 4.0 | 7.0 | 10.0 | 12.0 | 8760.0 | 15.720548 | ... | 17.25 | 23.0 | 8760.0 | 91.407648 | 144.097932 | -999.0 | 30.0 | 71.0 | 137.0 | 886.0 |
| 2014 | 8760.0 | 6.526027 | 3.448048 | 1.0 | 4.0 | 7.0 | 10.0 | 12.0 | 8760.0 | 15.720548 | ... | 17.25 | 23.0 | 8760.0 | 85.339498 | 148.629825 | -999.0 | 27.0 | 70.5 | 132.0 | 671.0 |
| 2015 | 8760.0 | 6.526027 | 3.448048 | 1.0 | 4.0 | 7.0 | 10.0 | 12.0 | 8760.0 | 15.720548 | ... | 17.25 | 23.0 | 8760.0 | 71.658904 | 139.751292 | -999.0 | 21.0 | 53.0 | 108.0 | 722.0 |
| 2016 | 8784.0 | 6.513661 | 3.451430 | 1.0 | 4.0 | 7.0 | 10.0 | 12.0 | 8784.0 | 15.756831 | ... | 17.25 | 23.0 | 8784.0 | 69.185679 | 98.532138 | -999.0 | 18.0 | 49.0 | 95.0 | 782.0 |
| 2017 | 4344.0 | 3.508287 | 1.710157 | 1.0 | 2.0 | 4.0 | 5.0 | 6.0 | 4344.0 | 15.602210 | ... | 17.25 | 23.0 | 4344.0 | 63.186464 | 120.349817 | -999.0 | 18.0 | 42.0 | 84.0 | 684.0 |
10 rows × 32 columns
bj.groupby('Month').describe()
| Year | Day | ... | Hour | Value | |||||||||||||||||
|---|---|---|---|---|---|---|---|---|---|---|---|---|---|---|---|---|---|---|---|---|---|
| count | mean | std | min | 25% | 50% | 75% | max | count | mean | ... | 75% | max | count | mean | std | min | 25% | 50% | 75% | max | |
| Month | |||||||||||||||||||||
| 1 | 6696.0 | 2013.000000 | 2.582182 | 2009.0 | 2011.00 | 2013.0 | 2015.00 | 2017.0 | 6696.0 | 16.000000 | ... | 17.25 | 23.0 | 6696.0 | -57.093489 | 412.008808 | -999.0 | 13.00 | 42.0 | 135.0 | 994.0 |
| 2 | 6096.0 | 2013.007874 | 2.579646 | 2009.0 | 2011.00 | 2013.0 | 2015.00 | 2017.0 | 6096.0 | 14.614173 | ... | 17.25 | 23.0 | 6096.0 | 18.046096 | 314.172648 | -999.0 | 14.00 | 56.0 | 138.0 | 980.0 |
| 3 | 6696.0 | 2013.000000 | 2.582182 | 2009.0 | 2011.00 | 2013.0 | 2015.00 | 2017.0 | 6696.0 | 16.000000 | ... | 17.25 | 23.0 | 6696.0 | 47.737007 | 228.207362 | -999.0 | 17.00 | 61.0 | 126.0 | 784.0 |
| 4 | 7017.0 | 2012.617358 | 2.815031 | 2008.0 | 2010.00 | 2013.0 | 2015.00 | 2017.0 | 7017.0 | 15.791364 | ... | 18.00 | 23.0 | 7017.0 | 38.818156 | 216.531285 | -999.0 | 27.00 | 63.0 | 111.0 | 722.0 |
| 5 | 7440.0 | 2012.500000 | 2.872474 | 2008.0 | 2010.00 | 2012.5 | 2015.00 | 2017.0 | 7440.0 | 16.000000 | ... | 17.25 | 23.0 | 7440.0 | 25.278629 | 234.123285 | -999.0 | 30.75 | 58.0 | 99.0 | 684.0 |
| ... | ... | ... | ... | ... | ... | ... | ... | ... | ... | ... | ... | ... | ... | ... | ... | ... | ... | ... | ... | ... | ... |
| 8 | 6696.0 | 2012.000000 | 2.582182 | 2008.0 | 2010.00 | 2012.0 | 2014.00 | 2016.0 | 6696.0 | 16.000000 | ... | 17.25 | 23.0 | 6696.0 | -4.060783 | 280.769261 | -999.0 | 23.00 | 56.0 | 97.0 | 360.0 |
| 9 | 6480.0 | 2012.000000 | 2.582188 | 2008.0 | 2010.00 | 2012.0 | 2014.00 | 2016.0 | 6480.0 | 15.500000 | ... | 17.25 | 23.0 | 6480.0 | 24.521914 | 239.468226 | -999.0 | 21.00 | 56.0 | 109.0 | 455.0 |
| 10 | 6696.0 | 2012.000000 | 2.582182 | 2008.0 | 2010.00 | 2012.0 | 2014.00 | 2016.0 | 6696.0 | 16.000000 | ... | 17.25 | 23.0 | 6696.0 | 73.224014 | 205.732168 | -999.0 | 22.00 | 65.0 | 151.0 | 562.0 |
| 11 | 5894.0 | 2012.397693 | 2.362521 | 2008.0 | 2010.00 | 2012.0 | 2014.00 | 2016.0 | 5894.0 | 15.222939 | ... | 17.00 | 23.0 | 5894.0 | 80.358331 | 215.824537 | -999.0 | 23.00 | 74.0 | 166.0 | 666.0 |
| 12 | 5952.0 | 2012.500000 | 2.291480 | 2009.0 | 2010.75 | 2012.5 | 2014.25 | 2016.0 | 5952.0 | 16.000000 | ... | 17.25 | 23.0 | 5952.0 | 54.884913 | 274.648725 | -999.0 | 17.00 | 59.0 | 173.0 | 634.0 |
12 rows × 32 columns
bj.pivot_table(index = 'Year',
           columns = 'Month', values = 'Value', aggfunc = max)
| Month | 1 | 2 | 3 | 4 | 5 | 6 | 7 | 8 | 9 | 10 | 11 | 12 |
|---|---|---|---|---|---|---|---|---|---|---|---|---|
| Year | ||||||||||||
| 2008 | NaN | NaN | NaN | 610.0 | 405.0 | 270.0 | 272.0 | 195.0 | 226.0 | 415.0 | 214.0 | NaN |
| 2009 | -999.0 | 178.0 | 390.0 | 327.0 | 266.0 | 712.0 | 551.0 | 334.0 | 326.0 | 361.0 | 590.0 | 479.0 |
| 2010 | 485.0 | 980.0 | 784.0 | 389.0 | 314.0 | 252.0 | 310.0 | 360.0 | 455.0 | 534.0 | 569.0 | 615.0 |
| 2011 | 286.0 | 595.0 | 416.0 | 279.0 | 264.0 | 459.0 | 390.0 | 341.0 | 386.0 | 562.0 | 404.0 | 522.0 |
| 2012 | 994.0 | 380.0 | 407.0 | 312.0 | 312.0 | 338.0 | 318.0 | 302.0 | 238.0 | 446.0 | 445.0 | 380.0 |
| 2013 | 886.0 | 532.0 | 541.0 | 275.0 | 320.0 | 466.0 | 216.0 | 208.0 | 298.0 | 407.0 | 394.0 | 480.0 |
| 2014 | 671.0 | 649.0 | 465.0 | 580.0 | 271.0 | 225.0 | 303.0 | 209.0 | 229.0 | 472.0 | 522.0 | 444.0 |
| 2015 | 568.0 | 407.0 | 318.0 | 722.0 | 261.0 | 258.0 | 151.0 | 141.0 | 206.0 | 356.0 | 666.0 | 634.0 |
| 2016 | 582.0 | 601.0 | 427.0 | 377.0 | 439.0 | 782.0 | 252.0 | 138.0 | 244.0 | 289.0 | 378.0 | 543.0 |
| 2017 | 596.0 | 386.0 | 281.0 | 230.0 | 684.0 | 130.0 | NaN | NaN | NaN | NaN | NaN | NaN |
2.北京PM2.5变化趋势分析(实战总结)
基本的数据准备
# 读入原始数据并建立索引
from datetime import datetime
bj = bj.iloc[:, [1, 6]]
bj.columns = ['datelst', 'value']
bj.set_index(pd.to_datetime(bj.datelst), inplace = True)
bj
| datelst | value | |
|---|---|---|
| datelst | ||
| 2008-04-08 15:00:00 | 2008-04-08 15:00 | 207 |
| 2008-04-08 16:00:00 | 2008-04-08 16:00 | 180 |
| 2008-04-08 17:00:00 | 2008-04-08 17:00 | 152 |
| 2008-04-08 18:00:00 | 2008-04-08 18:00 | 162 |
| 2008-04-08 19:00:00 | 2008-04-08 19:00 | 171 |
| ... | ... | ... |
| 2017-06-30 19:00:00 | 6/30/2017 19:00 | 51 |
| 2017-06-30 20:00:00 | 6/30/2017 20:00 | 68 |
| 2017-06-30 21:00:00 | 6/30/2017 21:00 | 61 |
| 2017-06-30 22:00:00 | 6/30/2017 22:00 | 49 |
| 2017-06-30 23:00:00 | 6/30/2017 23:00 | 55 |
79559 rows × 2 columns
# 缺失值处理
bj = bj[bj.value > 0]
bj
| datelst | value | |
|---|---|---|
| datelst | ||
| 2008-04-08 15:00:00 | 2008-04-08 15:00 | 207 |
| 2008-04-08 16:00:00 | 2008-04-08 16:00 | 180 |
| 2008-04-08 17:00:00 | 2008-04-08 17:00 | 152 |
| 2008-04-08 18:00:00 | 2008-04-08 18:00 | 162 |
| 2008-04-08 19:00:00 | 2008-04-08 19:00 | 171 |
| ... | ... | ... |
| 2017-06-30 19:00:00 | 6/30/2017 19:00 | 51 |
| 2017-06-30 20:00:00 | 6/30/2017 20:00 | 68 |
| 2017-06-30 21:00:00 | 6/30/2017 21:00 | 61 |
| 2017-06-30 22:00:00 | 6/30/2017 22:00 | 49 |
| 2017-06-30 23:00:00 | 6/30/2017 23:00 | 55 |
75058 rows × 2 columns
bj.index.date#只取到年月日
array([datetime.date(2008, 4, 8), datetime.date(2008, 4, 8),
       datetime.date(2008, 4, 8), ..., datetime.date(2017, 6, 30),
       datetime.date(2017, 6, 30), datetime.date(2017, 6, 30)],
      dtype=object)
# 取每日最大值作为当日PM代表
bjana = bj.groupby(bj.index.date).agg(max)
type(bjana.index)
pandas.core.indexes.base.Index
# 将索引重建为DatetimeIndex格式
bjana.index = pd.to_datetime(bjana.index)
type(bjana.index)
pandas.core.indexes.datetimes.DatetimeIndex
考察数据的基本分布特征
数据的基本分布
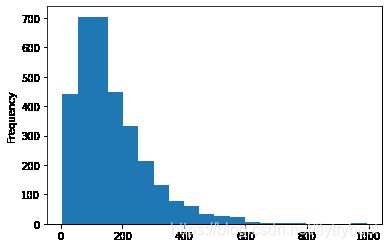
# PM数值的整体分布
%matplotlib inline
bjana.value.plot.hist(bins = 20)
# 检查逐月数据缺失情况
pd.crosstab(index=bjana.index.year, columns=bjana.index.month)
#cross出有数值的个数
| col_0 | 1 | 2 | 3 | 4 | 5 | 6 | 7 | 8 | 9 | 10 | 11 | 12 |
|---|---|---|---|---|---|---|---|---|---|---|---|---|
| row_0 | ||||||||||||
| 2008 | 0 | 0 | 0 | 23 | 31 | 30 | 30 | 31 | 30 | 31 | 6 | 0 |
| 2009 | 0 | 10 | 29 | 30 | 24 | 29 | 31 | 31 | 30 | 31 | 28 | 28 |
| 2010 | 29 | 28 | 31 | 30 | 31 | 28 | 31 | 29 | 23 | 31 | 29 | 31 |
| 2011 | 30 | 28 | 28 | 29 | 31 | 30 | 31 | 28 | 30 | 28 | 30 | 31 |
| 2012 | 29 | 29 | 31 | 30 | 30 | 30 | 30 | 28 | 30 | 31 | 30 | 27 |
| 2013 | 31 | 28 | 31 | 30 | 31 | 30 | 31 | 31 | 30 | 31 | 30 | 31 |
| 2014 | 31 | 28 | 31 | 30 | 31 | 30 | 31 | 31 | 30 | 31 | 30 | 31 |
| 2015 | 31 | 28 | 31 | 30 | 31 | 30 | 31 | 31 | 30 | 31 | 30 | 31 |
| 2016 | 31 | 29 | 31 | 30 | 31 | 30 | 31 | 31 | 30 | 31 | 30 | 31 |
| 2017 | 31 | 28 | 31 | 30 | 31 | 30 | 0 | 0 | 0 | 0 | 0 | 0 |
数据的基本变化规律
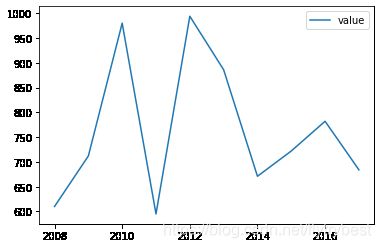
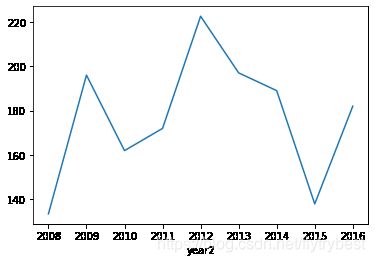
bjana.groupby(bjana.index.year).median().plot()
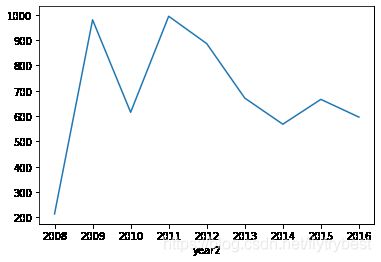
bjana.groupby(bjana.index.year).max().plot()
bjana.groupby(bjana.index.month).median().plot()
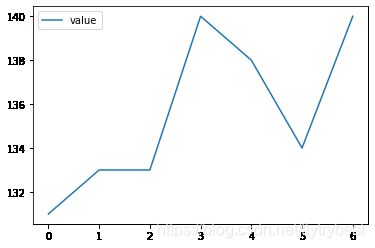
bjana.groupby(bjana.index.weekday).median().plot()
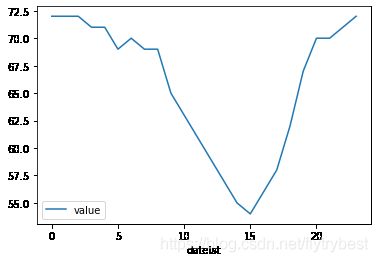
bj.groupby(bj.index.hour).median().plot()
对时间周期作必要的调整
为了更好地看出秋冬变化,将第二年一月和二月的数据加入
# 对年份和月份数值做调整
bjana['month2'] = bjana.index.month
bjana.month2.replace([1, 2], [13, 14], inplace = True)
bjana['year2'] = bjana.index.year
bjana.loc[bjana.month2 > 12, 'year2'] -= 1
bjana['2010']
| datelst | value | month2 | year2 | |
|---|---|---|---|---|
| 2010-01-01 | 2010-01-01 23:00 | 129 | 13 | 2009 |
| 2010-01-02 | 2010-01-02 23:00 | 181 | 13 | 2009 |
| 2010-01-03 | 2010-01-03 23:00 | 107 | 13 | 2009 |
| 2010-01-04 | 2010-01-04 23:00 | 58 | 13 | 2009 |
| 2010-01-05 | 2010-01-05 23:00 | 106 | 13 | 2009 |
| ... | ... | ... | ... | ... |
| 2010-12-27 | 2010-12-27 23:00 | 161 | 12 | 2010 |
| 2010-12-28 | 2010-12-28 23:00 | 106 | 12 | 2010 |
| 2010-12-29 | 2010-12-29 23:00 | 69 | 12 | 2010 |
| 2010-12-30 | 2010-12-30 23:00 | 28 | 12 | 2010 |
| 2010-12-31 | 2010-12-31 22:00 | 28 | 12 | 2010 |
351 rows × 4 columns
提取秋冬季四个月的数据进行考察
bjana[bjana.month2 > 10].groupby(bjana.year2).value.median().plot()
bjana[bjana.month2 > 10].groupby(bjana.year2).value.max().plot()
计算爆表天数(这是分析的考虑因素之一)
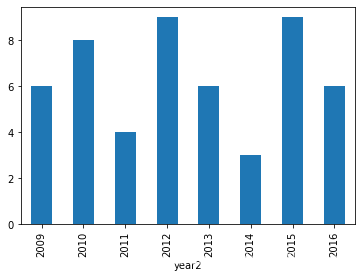
bjana[bjana.value > 500].groupby(bjana.year2).value.count().plot.bar()
bjana.query("value > 500 and month2 > 10").\
groupby(bjana.year2).value.count().plot.bar()

#在引用的时候可以用\来换行 \ 后面不要加注释
bjana.query("value > 500 and month2 >= 10").\
    groupby(bjana.year2).value.count().plot.bar()
3. 优化Pandas
除非对相应的优化手段已经非常熟悉,否则代码的可读性应当被放在首位。
pandas为了易用性,确实牺牲了一些效率,但同时也预留了相应的优化路径。因此如果要进行优化,熟悉并优先使用pandas自身提供的优化套路至关重要。
尽量使用pandas(或者numpy)内置的函数进行运算,一般效率都会更高。
在可以用几种内部函数实现相同需求时,最好进行计算效率的比较,差距可能很大。
pandas官方提供的讨论如何进行优化的文档:https://pandas.pydata.org/pandas-docs/stable/user_guide/enhancingperf.html
学会使用各种计时工具
%time(计算紧跟在后面程序的时间)和%timeit(自动计算多次的出平均时间)%%timeit后面一段程序的平均时间
需要在IPython下才可以使用
%time bj["tmp"] = bj.Month + 10 # 运行当前代码所需时间
#(在此之前重新运行读入bj的代码)
Wall time: 1.96 ms
%timeit bj["tmp"] = bj.Month + 10
484 µs ± 16.8 µs per loop (mean ± std. dev. of 7 runs, 1000 loops each)
%%timeit    # 运行整个程序段所需平均时间

bj["tmp"] = bj.Month + 10
bj["tmp"] = bj.Month + 10
bj["tmp"] = bj.Month + 10
bj["tmp"] = bj.Month + 10
2.31 ms ± 183 µs per loop (mean ± std. dev. of 7 runs, 100 loops each)
import datetime
import time

time0 = datetime.datetime.now()

bj["tmp"] = bj.Month + 10

print(str(datetime.datetime.now() - time0))
#固定程序,学会套用即可,计算程序运行时间
0:00:00.002955
超大数据文件的处理
超大数据文件在使用pandas进行处理时可能需要考虑两个问题:读取速度,内存用量。
往往会考虑读入部分数据进行代码编写和调试,然后再对完整数据进行处理。 在数据读入和处理时需要加快处理速度,减少资源占用。
一些基本原则:
1.当明确知道数据列的取值范围时,读取数据时可以使用dtype参数来手动指定类型,如np.uint8或者np.int16,否则默认的np.int64类型等内存开销明显非常大。
2.尽量少用类型模糊的object,改用更明确的category等(用astype()转换)。
3.对类别取值较少,但案例数极多的变量,读入后尽量转换为数值代码进行处理。
data = pd.DataFrame({"a" : [0,1, 2, 3, 4, 5, 6, 7, 8, 9],
                     "b" : ["员工编号","员工编号","领导编号","领导编号",
                            "员工编号","员工编号","员工编号","领导编号",
                            "领导编号","员工编号"]})
print(data)
data.info()
   a     b
0  0  员工编号
1  1  员工编号
2  2  领导编号
3  3  领导编号
4  4  员工编号
5  5  员工编号
6  6  员工编号
7  7  领导编号
8  8  领导编号
9  9  员工编号

RangeIndex: 10 entries, 0 to 9
Data columns (total 2 columns):
 #   Column  Non-Null Count  Dtype
---  ------  --------------  -----
 0   a       10 non-null     int64
 1   b       10 non-null     object
dtypes: int64(1), object(1)
memory usage: 288.0+ bytes
data['a'] = pd.to_numeric(data['a'], downcast = 'integer')
data['b'] = data['b'].astype('category')
print(data)
   a     b
0  0  员工编号
1  1  员工编号
2  2  领导编号
3  3  领导编号
4  4  员工编号
5  5  员工编号
6  6  员工编号
7  7  领导编号
8  8  领导编号
9  9  员工编号
data.b.head() # category格式明显更节省内存
0    员工编号
1    员工编号
2    领导编号
3    领导编号
4    员工编号
Name: b, dtype: category
Categories (2, object): ['员工编号', '领导编号']
data.info()
RangeIndex: 10 entries, 0 to 9
Data columns (total 2 columns):
 #   Column  Non-Null Count  Dtype
---  ------  --------------  -----
 0   a       10 non-null     int8
 1   b       10 non-null     category
dtypes: category(1), int8(1)
memory usage: 244.0 bytes
data.b.astype('str') # 必要时category也可以转换回str
0    员工编号
1    员工编号
2    领导编号
3    领导编号
4    员工编号
5    员工编号
6    员工编号
7    领导编号
8    领导编号
9    员工编号
Name: b, dtype: object
对文件进行分段读取
使用chunksize参数
filename = "pm25/Beijing_2008_HourlyPM2.5_created20140325.csv"
dftmp = pd.read_csv(filename, header = 2,
                    usecols = [0,2,3,4,5,6,7], chunksize = 5)

type(dftmp) # 注意得到的并不是一个数据框,而是TextFileReader
pandas.io.parsers.TextFileReader
cnt = 0
for item in dftmp: # 注意重复运行之后的效果
    print(item)
    cnt += 1
    if cnt > 2:
        break
      Site        Date (LST)  Year  Month  Day  Hour  Value
0  Beijing  2008-04-08 15:00  2008      4    8    15    207
1  Beijing  2008-04-08 16:00  2008      4    8    16    180
2  Beijing  2008-04-08 17:00  2008      4    8    17    152
3  Beijing  2008-04-08 18:00  2008      4    8    18    162
4  Beijing  2008-04-08 19:00  2008      4    8    19    171
      Site        Date (LST)  Year  Month  Day  Hour  Value
5  Beijing  2008-04-08 20:00  2008      4    8    20    219
6  Beijing  2008-04-08 21:00  2008      4    8    21     86
7  Beijing  2008-04-08 22:00  2008      4    8    22     63
8  Beijing  2008-04-08 23:00  2008      4    8    23     61
9  Beijing  2008-04-09 00:00  2008      4    9     0     64
       Site        Date (LST)  Year  Month  Day  Hour  Value
10  Beijing  2008-04-09 01:00  2008      4    9     1     64
11  Beijing  2008-04-09 02:00  2008      4    9     2     69
12  Beijing  2008-04-09 03:00  2008      4    9     3     80
13  Beijing  2008-04-09 04:00  2008      4    9     4     71
14  Beijing  2008-04-09 05:00  2008      4    9     5     73
使用iterator参数和get_chunk()组合
dfiter = pd.read_csv(filename, header = 2,
                     usecols = [0,2,3,4,5,6,7], iterator = True)

type(dfiter) # 注意得到的并不是一个数据框,而是TextFileReader
pandas.io.parsers.TextFileReader
cnt = 0
for item in dfiter: # 注意结果是否正确
    print(item)
    cnt += 1
    if cnt > 2:
        break
         Site        Date (LST)  Year  Month  Day  Hour  Value
0     Beijing  2008-04-08 15:00  2008      4    8    15    207
1     Beijing  2008-04-08 16:00  2008      4    8    16    180
2     Beijing  2008-04-08 17:00  2008      4    8    17    152
3     Beijing  2008-04-08 18:00  2008      4    8    18    162
4     Beijing  2008-04-08 19:00  2008      4    8    19    171
...       ...               ...   ...    ...  ...   ...    ...
5082  Beijing  2008-11-06 09:00  2008     11    6     9     42
5083  Beijing  2008-11-06 10:00  2008     11    6    10     46
5084  Beijing  2008-11-06 11:00  2008     11    6    11     40
5085  Beijing  2008-11-06 12:00  2008     11    6    12     35
5086  Beijing  2008-11-06 13:00  2008     11    6    13     19

[5087 rows x 7 columns]
# TextFileReader使用完毕后已经失效,需要重新建立
dfiter.get_chunk(10) # 注意重复运行之后的效果
| Site | Date (LST) | Year | Month | Day | Hour | Value | |
|---|---|---|---|---|---|---|---|
| 0 | Beijing | 2008-04-08 15:00 | 2008 | 4 | 8 | 15 | 207 |
| 1 | Beijing | 2008-04-08 16:00 | 2008 | 4 | 8 | 16 | 180 |
| 2 | Beijing | 2008-04-08 17:00 | 2008 | 4 | 8 | 17 | 152 |
| 3 | Beijing | 2008-04-08 18:00 | 2008 | 4 | 8 | 18 | 162 |
| 4 | Beijing | 2008-04-08 19:00 | 2008 | 4 | 8 | 19 | 171 |
| 5 | Beijing | 2008-04-08 20:00 | 2008 | 4 | 8 | 20 | 219 |
| 6 | Beijing | 2008-04-08 21:00 | 2008 | 4 | 8 | 21 | 86 |
| 7 | Beijing | 2008-04-08 22:00 | 2008 | 4 | 8 | 22 | 63 |
| 8 | Beijing | 2008-04-08 23:00 | 2008 | 4 | 8 | 23 | 61 |
| 9 | Beijing | 2008-04-09 00:00 | 2008 | 4 | 9 | 0 | 64 |
使用modin包
modin使用并行方式对pandas中的文件读取和常见操作进行执行。
windows环境下只能使用dask引擎,其余环境下还可以使用ray
目前还不支持pandas 1.00及以上版本,只支持到0.25版本
pip install modin[dask]
非必要不要安装,可能会导致pandas降级
filename = "pm25/Beijing_2008_HourlyPM2.5_created20140325.csv"
%timeit dftmp = pd.read_csv(filename, header = 2, usecols = [0,2,3,4,5,6,7,9,10])
8.73 ms ± 113 µs per loop (mean ± std. dev. of 7 runs, 100 loops each)
import modin.pandas as pd # 只需要在这里进行修改即可

%timeit dftmp = pd.read_csv(filename, header = 2, usecols = [0,2,3,4,5,6,7,9,10])
如何优化pandas的代码
尽量不要在pandas中使用循环(行/列/单元格遍历)!!!
如果循环很难避免,尽量在循环体中使用numpy做计算。
%%time

# 标准的行/列遍历循环方式效率最差

bj['new'] = 0
for i in range(bj.shape[0]):
    bj.iloc[i, 9] = bj.iloc[i, 3] + 10
Wall time: 25.6 s
# apply自定义函数/外部函数效率稍差
def m_add(x):
    return x + 10

%timeit bj["new"] = bj.Month.apply(lambda x : m_add(x))
30.2 ms ± 1.83 ms per loop (mean ± std. dev. of 7 runs, 10 loops each)
# 在apply中应用内置函数方式多数情况下速度更快
%timeit bj["new"] = bj.Month.apply(lambda x : x + 10)
24.9 ms ± 2.44 ms per loop (mean ± std. dev. of 7 runs, 10 loops each)
# 直接应用原生内置函数方式速度最快(此即所谓的矢量化计算)
%timeit bj["new"] = bj.Month + 10
570 µs ± 24.4 µs per loop (mean ± std. dev. of 7 runs, 1000 loops each)
如何进行多列数据的计算
同时涉及多列数据的计算不仅需要考虑速度优化问题,还需要考虑代码简洁性的问题。
利用lambda函数完成
%%timeit

def m_add(a, b, c):
    return a + b + c

bj['new'] = bj.apply(lambda x :
                     m_add(x['Month'], x['Day'], x['Hour']), axis = 1)
1.07 s ± 33.8 ms per loop (mean ± std. dev. of 7 runs, 1 loop each)
%%timeit

# lambda多参方式,因为x[0]等需要逐行定位,也浪费时间

bj['new'] = bj[['Month', 'Day', 'Hour']].apply(lambda x :
                                               x[0] + x[1] + x[2],
                                               axis = 1)
821 ms ± 68.8 ms per loop (mean ± std. dev. of 7 runs, 1 loop each)
# 还是原生方式快
%timeit bj['new'] = bj['Month'] + bj['Day'] + bj['Hour']
895 µs ± 18 µs per loop (mean ± std. dev. of 7 runs, 1000 loops each)
pd.eval()命令
pd.eval()的功能仍是给表达式估值,但是基于pandas时,就可以直接利用列名等信息用于计算。
# eval()默认会使用numexpr而不是python计算引擎,复杂计算时效率很高
# engine参数在调用numexpr失败时会切换为python引擎,一般不用干涉
%timeit bj.eval('new = Month + Day + Hour', inplace = True)
3 ms ± 125 µs per loop (mean ± std. dev. of 7 runs, 100 loops each)
# eval()默认会使用numexpr而不是python计算引擎,复杂计算时效率很高
%timeit bj.eval('new = Month + Day + Hour', engine = 'python', inplace = True)
3.04 ms ± 33.5 µs per loop (mean ± std. dev. of 7 runs, 100 loops each)
pd.在eval()表达式中进一步使用局部变量
@varname:在表达式中使用名称为varname的Python局部变量。
该@符号在query()和eval()中均可使用。
varx = 3
bj.eval('new = Month + Day + Hour + @varx').head()
| Site | Date (LST) | Year | Month | Day | Hour | Value | Duration | QC Name | tmp | new | |
|---|---|---|---|---|---|---|---|---|---|---|---|
| 0 | Beijing | 2008-04-08 15:00 | 2008 | 4 | 8 | 15 | 207 | 1 Hr | Valid | 14 | 30 |
| 1 | Beijing | 2008-04-08 16:00 | 2008 | 4 | 8 | 16 | 180 | 1 Hr | Valid | 14 | 31 |
| 2 | Beijing | 2008-04-08 17:00 | 2008 | 4 | 8 | 17 | 152 | 1 Hr | Valid | 14 | 32 |
| 3 | Beijing | 2008-04-08 18:00 | 2008 | 4 | 8 | 18 | 162 | 1 Hr | Valid | 14 | 33 |
| 4 | Beijing | 2008-04-08 19:00 | 2008 | 4 | 8 | 19 | 171 | 1 Hr | Valid | 14 | 34 |
利用各种pandas加速包
大部分包都是基于linux环境,windows下能用的不多。
大部分包还处于测试阶段,功能上并未完善
因为外包可能会有代码兼容性的问题,非必要尽量使用内置函数
numba
对编写的自定义函数进行编译,以提高运行效率。
A Just-In-Time Compiler for Numerical Functions in Python
具体使用的是C++编写的LLVM(Low Level Virtual Machine) compiler
实际上主要是针对numpy库进行优化编译,并不仅限于pandas
import random

def monte_carlo_pi(nsamples):
    acc = 0
    for i in range(nsamples):
        x = random.random()
        y = random.random()
        if (x ** 2 + y ** 2) < 1.0:
            acc += 1
    return 4.0 * acc / nsamples

%timeit monte_carlo_pi(20) # 运行被监控的函数,获取各部分占用的运行时间数据
11.6 µs ± 380 ns per loop (mean ± std. dev. of 7 runs, 100000 loops each)
from numba import jit

@jit(nopython = True) # nopython模式下性能最好
def monte_carlo_pi(nsamples):
    acc = 0
    for i in range(nsamples):
        x = random.random()
        y = random.random()
        if (x ** 2 + y ** 2) < 1.0:
            acc += 1
    return 4.0 * acc / nsamples

%timeit monte_carlo_pi(20)
The slowest run took 11.33 times longer than the fastest. This could mean that an intermediate result is being cached.
914 ns ± 1.04 µs per loop (mean ± std. dev. of 7 runs, 1 loop each)
from numba import jit

@jit
def monte_carlo_pi(nsamples):
    acc = 0
    for i in range(nsamples):
        x = random.random()
        y = random.random()
        if (x ** 2 + y ** 2) < 1.0:
            acc += 1
    return 4.0 * acc / nsamples

%timeit monte_carlo_pi(20)
443 ns ± 15.4 ns per loop (mean ± std. dev. of 7 runs, 1000000 loops each)
swifter
对apply函数进行并行操作。
是专门针对pandas进行优化的工具包
