mysql 三阶多项式拟合,《统计学习导论-基于R应用》第三章:线性回归(代码)...
库library
库:一组不含在基础R配置内的函数和数据集
library(MASS) # 加载库
library(ISLR)# 安装库 install.packages("ISLR")
简单线性回归
fix(Boston) # 查看Boston数据集
names(Boston) # 查看数据集的列名(预测变量+响应变量medv)
'crim'
'zn'
'indus'
'chas'
'nox'
'rm'
'age'
'dis'
'rad'
'tax'
'ptratio'
'black'
'lstat'
'medv'
?Boston # 查看数据集的更多信息
线性拟合
# 方法一
lm.fit = lm(medv~lstat,data= Boston) # 指定数据集
# 方法二
attach(Boston) # 绑定数据集
lm.fit = lm(medv~lstat)
lm.fit # 给出拟合函数的基础信息
Call:
lm(formula = medv ~ lstat)
Coefficients:
(Intercept) lstat
34.55 -0.95
summary(lm.fit) # 给出拟合函数各类信息
Call:
lm(formula = medv ~ lstat)
Residuals:
Min 1Q Median 3Q Max
-15.168 -3.990 -1.318 2.034 24.500
Coefficients:
Estimate Std. Error t value Pr(>|t|)
(Intercept) 34.55384 0.56263 61.41 <2e-16 ***
lstat -0.95005 0.03873 -24.53 <2e-16 ***
---
Signif. codes: 0 '***' 0.001 '**' 0.01 '*' 0.05 '.' 0.1 ' ' 1
Residual standard error: 6.216 on 504 degrees of freedom
Multiple R-squared: 0.5441,Adjusted R-squared: 0.5432
F-statistic: 601.6 on 1 and 504 DF, p-value: < 2.2e-16
names(lm.fit) # 列出拟合函数存储的所有信息种类
'coefficients'
'residuals'
'effects'
'rank'
'fitted.values'
'assign'
'qr'
'df.residual'
'xlevels'
'call'
'terms'
'model'
coef(lm.fit) # 提取拟合参数(系数估计值)
(Intercept) 34.5538408793831
lstat -0.950049353757991
confint(lm.fit) # 系数估计值的置信区间
2.5 %
97.5 %
(Intercept)
33.448457
35.6592247
lstat
-1.026148
-0.8739505
# 根据指定预测变量计算响应变量,同时给出置信空间或者预测空间
predict(lm.fit, data.frame(lstat=(c(5,10,15))), interval = "confidence") # 置信空间
fit
lwr
upr
1
29.80359
29.00741
30.59978
2
25.05335
24.47413
25.63256
3
20.30310
19.73159
20.87461
predict(lm.fit, data.frame(lstat=(c(5,10,15))), interval = "prediction") # 预测空间
fit
lwr
upr
1
29.80359
17.565675
42.04151
2
25.05335
12.827626
37.27907
3
20.30310
8.077742
32.52846
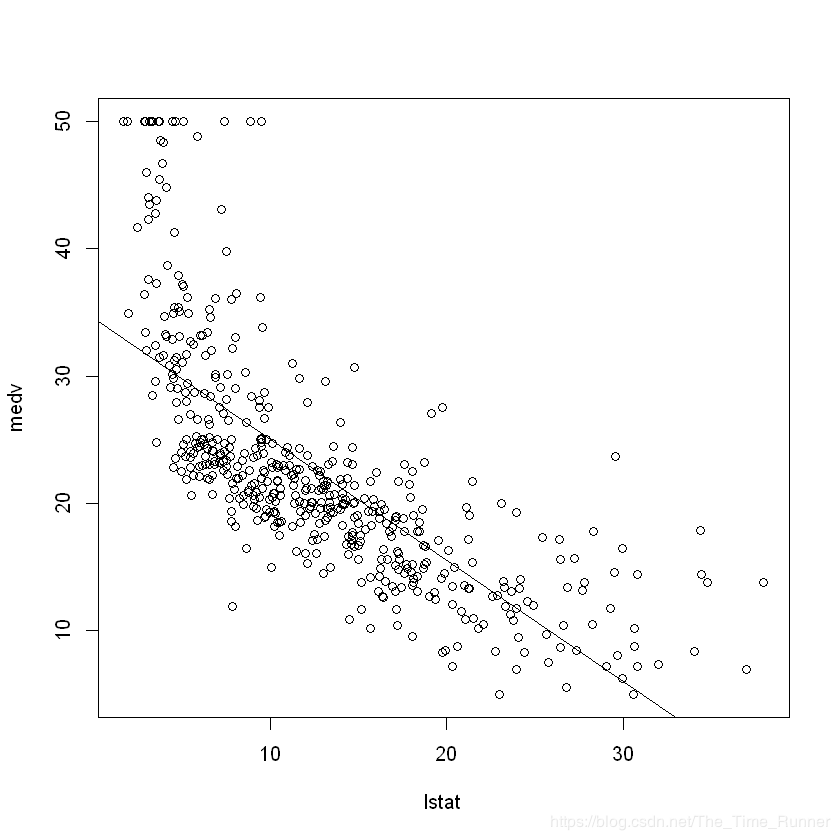
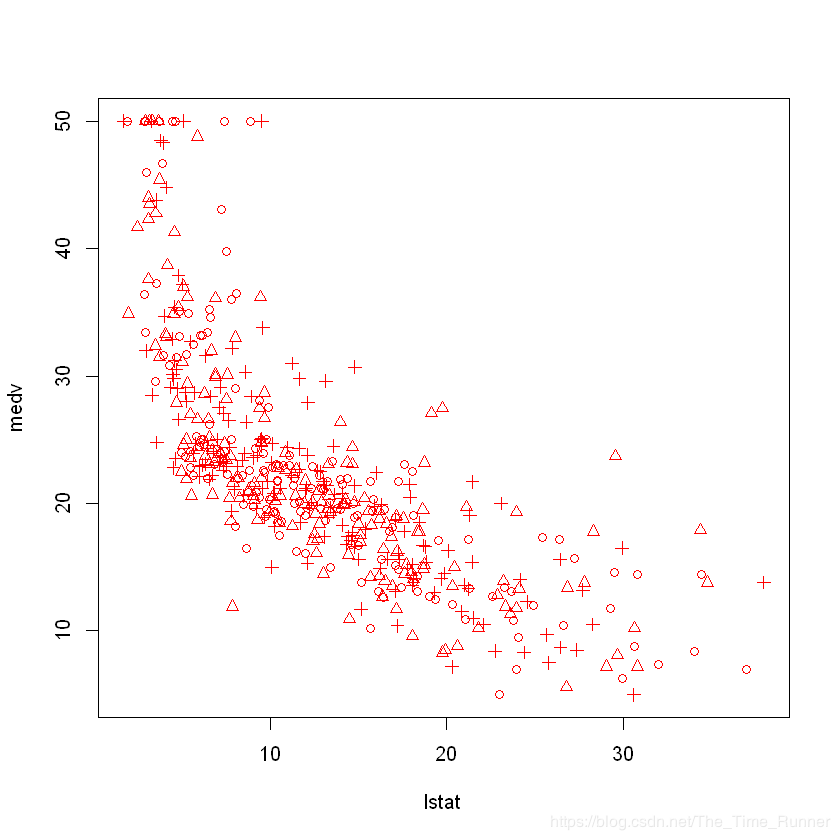
plot(lstat,medv) # 散点图
abline(lm.fit) # 添加最小二乘回归直线
# abline(a,b) 绘制截距为a,斜率为b的直线
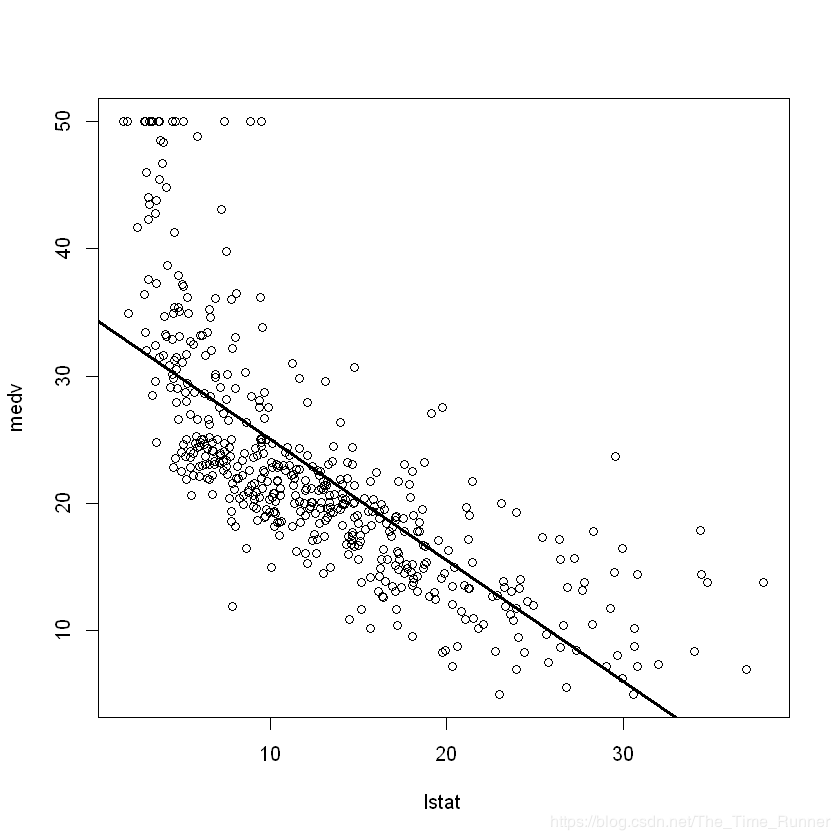
plot(lstat, medv)
abline(lm.fit, lwd = 3) # 线宽
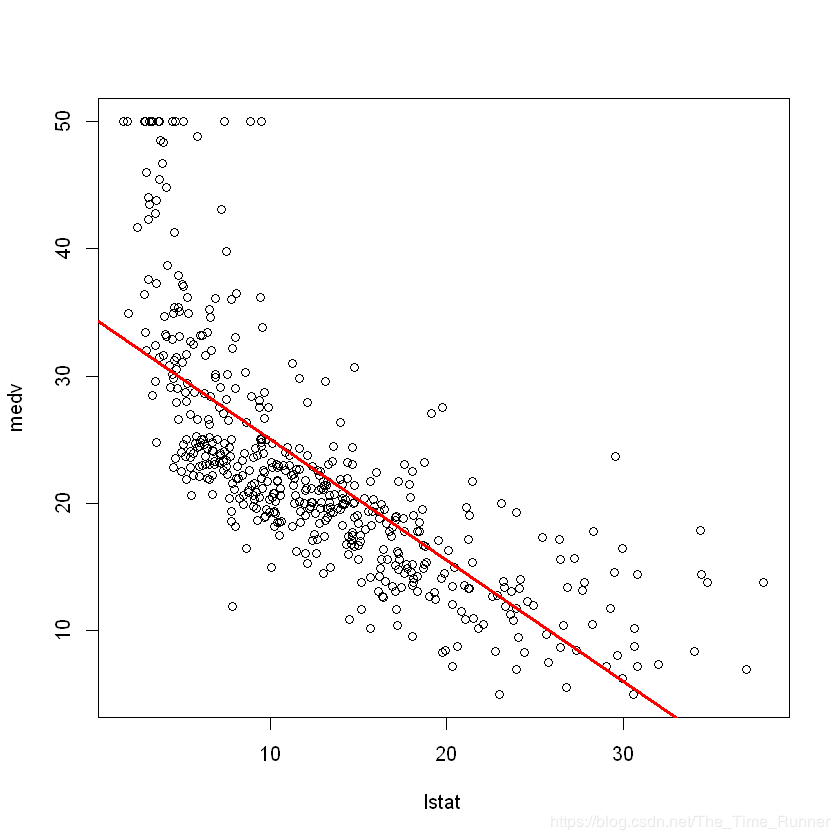
plot(lstat, medv)
abline(lm.fit, lwd = 3, col = "red") # 颜色
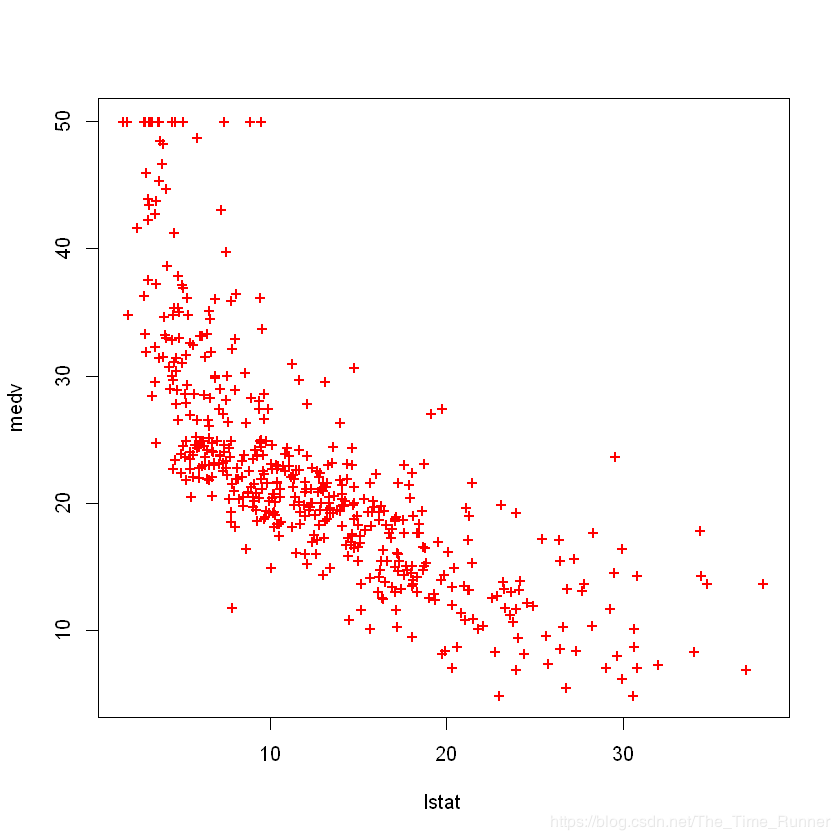
plot(lstat, medv, col="red", pch = "+") #图形符号
plot(lstat, medv, col="red", pch = 1:3) #图形符号
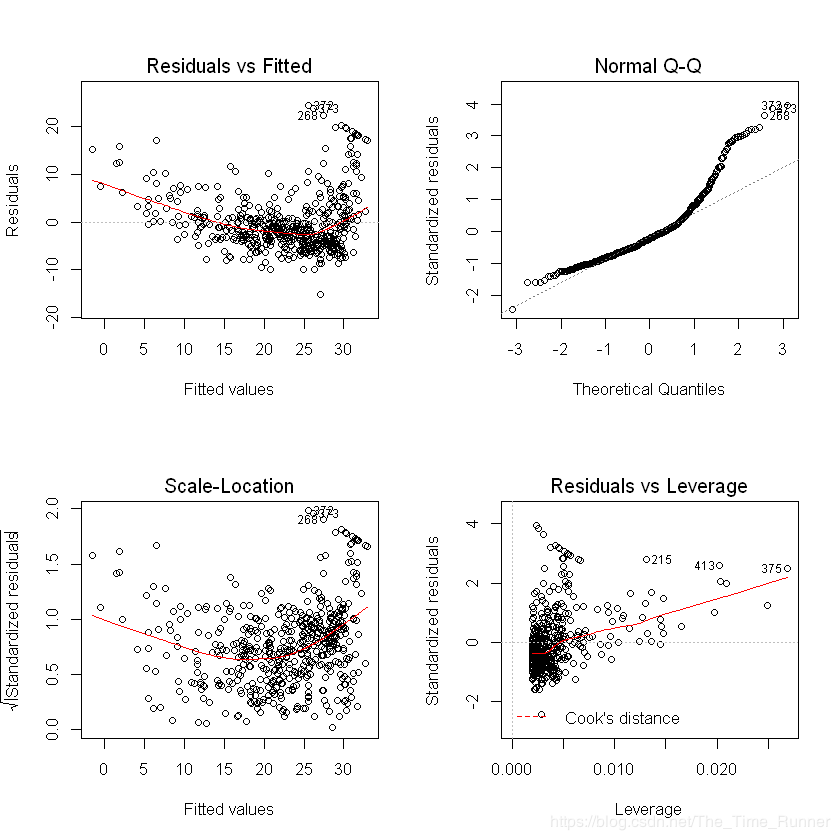
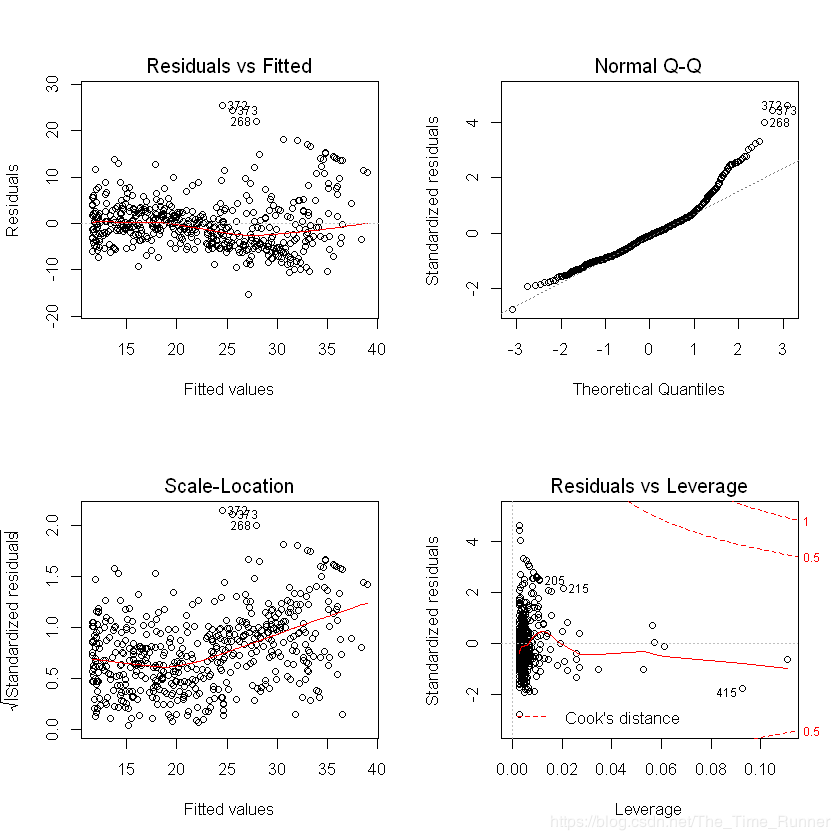
par(mfrow=c(2,2)) # 划分网格
plot(lm.fit) # 绘制诊断图
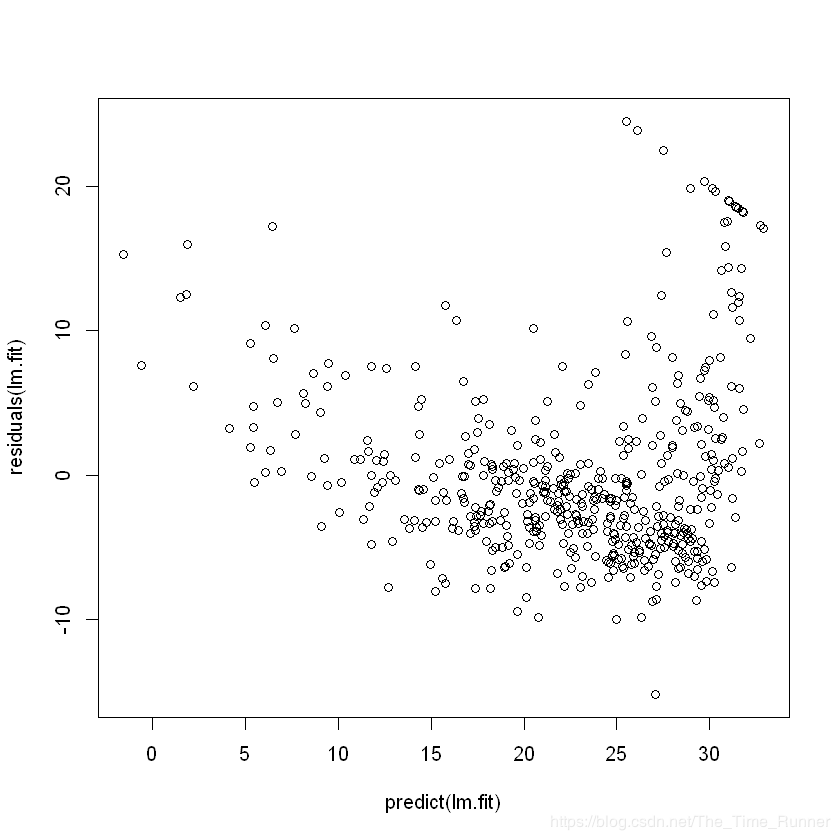
plot(predict(lm.fit),residuals(lm.fit)) # 残差对拟合值的散点图
残差显示,数据有非线性
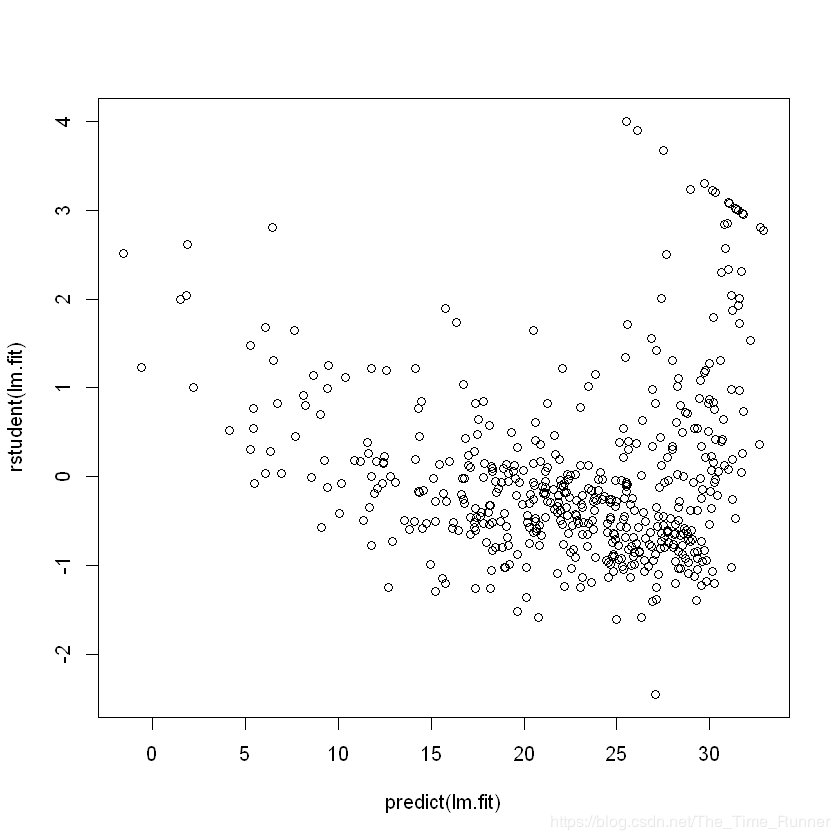
plot(predict(lm.fit),rstudent(lm.fit)) # 学生化残差对拟合值的散点图
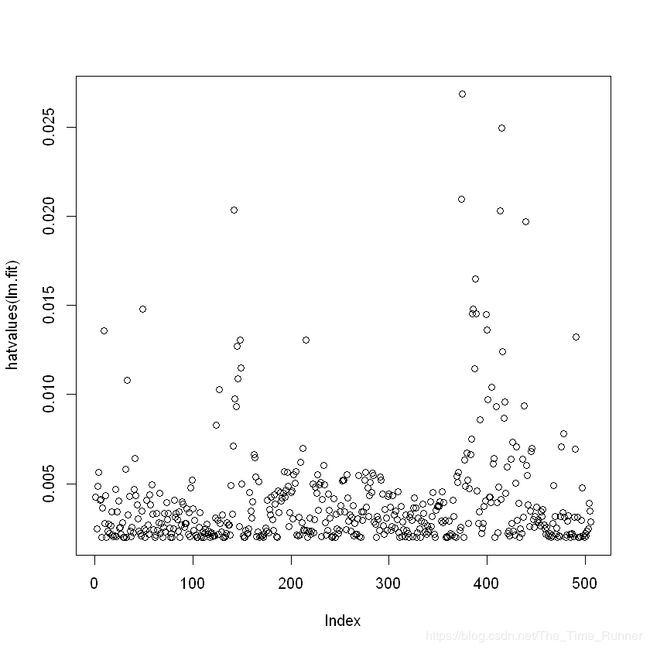
plot(hatvalues(lm.fit)) # 杠杆统计量
which.max(hatvalues(lm.fit)) # 最大元素(杠杆统计量)的索引
375: 375
多元线性回归
lm.fit = lm(medv~ lstat+age, data = Boston) # 对两个预测变量进行拟合
summary(lm.fit)
Call:
lm(formula = medv ~ lstat + age, data = Boston)
Residuals:
Min 1Q Median 3Q Max
-15.981 -3.978 -1.283 1.968 23.158
Coefficients:
Estimate Std. Error t value Pr(>|t|)
(Intercept) 33.22276 0.73085 45.458 < 2e-16 ***
lstat -1.03207 0.04819 -21.416 < 2e-16 ***
age 0.03454 0.01223 2.826 0.00491 **
---
Signif. codes: 0 '***' 0.001 '**' 0.01 '*' 0.05 '.' 0.1 ' ' 1
Residual standard error: 6.173 on 503 degrees of freedom
Multiple R-squared: 0.5513,Adjusted R-squared: 0.5495
F-statistic: 309 on 2 and 503 DF, p-value: < 2.2e-16
lm.fit = lm(medv~.,data = Boston) # 对所有预测变量进行拟合
summary(lm.fit)
Call:
lm(formula = medv ~ ., data = Boston)
Residuals:
Min 1Q Median 3Q Max
-15.595 -2.730 -0.518 1.777 26.199
Coefficients:
Estimate Std. Error t value Pr(>|t|)
(Intercept) 3.646e+01 5.103e+00 7.144 3.28e-12 ***
crim -1.080e-01 3.286e-02 -3.287 0.001087 **
zn 4.642e-02 1.373e-02 3.382 0.000778 ***
indus 2.056e-02 6.150e-02 0.334 0.738288
chas 2.687e+00 8.616e-01 3.118 0.001925 **
nox -1.777e+01 3.820e+00 -4.651 4.25e-06 ***
rm 3.810e+00 4.179e-01 9.116 < 2e-16 ***
age 6.922e-04 1.321e-02 0.052 0.958229
dis -1.476e+00 1.995e-01 -7.398 6.01e-13 ***
rad 3.060e-01 6.635e-02 4.613 5.07e-06 ***
tax -1.233e-02 3.760e-03 -3.280 0.001112 **
ptratio -9.527e-01 1.308e-01 -7.283 1.31e-12 ***
black 9.312e-03 2.686e-03 3.467 0.000573 ***
lstat -5.248e-01 5.072e-02 -10.347 < 2e-16 ***
---
Signif. codes: 0 '***' 0.001 '**' 0.01 '*' 0.05 '.' 0.1 ' ' 1
Residual standard error: 4.745 on 492 degrees of freedom
Multiple R-squared: 0.7406,Adjusted R-squared: 0.7338
F-statistic: 108.1 on 13 and 492 DF, p-value: < 2.2e-16
?summary.lm # 产看所有可用项目
summary(lm.fit)$r.sq # R^2
summary(lm.fit)$sigma # RSE
0.740642664109409
4.74529818169963
library(car)
vif(lm.fit) # 方差膨胀因子
Loading required package: carData
crim 1.79219154743325
zn 2.29875817874944
indus 3.99159641834604
chas 1.07399532755379
nox 4.3937198475775
rm 1.93374443578326
age 3.10082551281534
dis 3.95594490637273
rad 7.48449633527449
tax 9.00855394759708
ptratio 1.7990840492489
black 1.34852107640638
lstat 2.94149107809193
# 除某一变量之外的所有变量拟合
# 方案一
lm.fit1 = lm(medv~.-age, data= Boston)
lm.fit1
Call:
lm(formula = medv ~ . - age, data = Boston)
Coefficients:
(Intercept) crim zn indus chas nox
36.436927 -0.108006 0.046334 0.020562 2.689026 -17.713540
rm dis rad tax ptratio black
3.814394 -1.478612 0.305786 -0.012329 -0.952211 0.009321
lstat
-0.523852
# 方案二
lm.fit1 = update(lm.fit, ~.-age)
lm.fit1
Call:
lm(formula = medv ~ crim + zn + indus + chas + nox + rm + dis +
rad + tax + ptratio + black + lstat, data = Boston)
Coefficients:
(Intercept) crim zn indus chas nox
36.436927 -0.108006 0.046334 0.020562 2.689026 -17.713540
rm dis rad tax ptratio black
3.814394 -1.478612 0.305786 -0.012329 -0.952211 0.009321
lstat
-0.523852
交互项
summary(lm(medv~lstat:age, data = Boston)) # 对lstat和age的交互项拟合
Call:
lm(formula = medv ~ lstat:age, data = Boston)
Residuals:
Min 1Q Median 3Q Max
-13.347 -4.372 -1.534 1.914 27.193
Coefficients:
Estimate Std. Error t value Pr(>|t|)
(Intercept) 30.1588631 0.4828240 62.46 <2e-16 ***
lstat:age -0.0077146 0.0003799 -20.31 <2e-16 ***
---
Signif. codes: 0 '***' 0.001 '**' 0.01 '*' 0.05 '.' 0.1 ' ' 1
Residual standard error: 6.827 on 504 degrees of freedom
Multiple R-squared: 0.4501,Adjusted R-squared: 0.449
F-statistic: 412.4 on 1 and 504 DF, p-value: < 2.2e-16
summary(lm(medv~lstat*age, data = Boston)) # 对lstat、age、lstat和age的交互项 ,三者进行拟合
summary(lm(medv~lstat+age+lstat:age, data = Boston)) # 对lstat、age、lstat和age的交互项 ,三者进行拟合
Call:
lm(formula = medv ~ lstat * age, data = Boston)
Residuals:
Min 1Q Median 3Q Max
-15.806 -4.045 -1.333 2.085 27.552
Coefficients:
Estimate Std. Error t value Pr(>|t|)
(Intercept) 36.0885359 1.4698355 24.553 < 2e-16 ***
lstat -1.3921168 0.1674555 -8.313 8.78e-16 ***
age -0.0007209 0.0198792 -0.036 0.9711
lstat:age 0.0041560 0.0018518 2.244 0.0252 *
---
Signif. codes: 0 '***' 0.001 '**' 0.01 '*' 0.05 '.' 0.1 ' ' 1
Residual standard error: 6.149 on 502 degrees of freedom
Multiple R-squared: 0.5557,Adjusted R-squared: 0.5531
F-statistic: 209.3 on 3 and 502 DF, p-value: < 2.2e-16
Call:
lm(formula = medv ~ lstat + age + lstat:age, data = Boston)
Residuals:
Min 1Q Median 3Q Max
-15.806 -4.045 -1.333 2.085 27.552
Coefficients:
Estimate Std. Error t value Pr(>|t|)
(Intercept) 36.0885359 1.4698355 24.553 < 2e-16 ***
lstat -1.3921168 0.1674555 -8.313 8.78e-16 ***
age -0.0007209 0.0198792 -0.036 0.9711
lstat:age 0.0041560 0.0018518 2.244 0.0252 *
---
Signif. codes: 0 '***' 0.001 '**' 0.01 '*' 0.05 '.' 0.1 ' ' 1
Residual standard error: 6.149 on 502 degrees of freedom
Multiple R-squared: 0.5557,Adjusted R-squared: 0.5531
F-statistic: 209.3 on 3 and 502 DF, p-value: < 2.2e-16
非线性变换
lm.fit2 = lm(medv~lstat+I(lstat^2))
summary(lm.fit)
Call:
lm(formula = medv ~ lstat + I(lstat^2))
Residuals:
Min 1Q Median 3Q Max
-15.2834 -3.8313 -0.5295 2.3095 25.4148
Coefficients:
Estimate Std. Error t value Pr(>|t|)
(Intercept) 42.862007 0.872084 49.15 <2e-16 ***
lstat -2.332821 0.123803 -18.84 <2e-16 ***
I(lstat^2) 0.043547 0.003745 11.63 <2e-16 ***
---
Signif. codes: 0 '***' 0.001 '**' 0.01 '*' 0.05 '.' 0.1 ' ' 1
Residual standard error: 5.524 on 503 degrees of freedom
Multiple R-squared: 0.6407,Adjusted R-squared: 0.6393
F-statistic: 448.5 on 2 and 503 DF, p-value: < 2.2e-16
lm.fit = lm(medv~lstat)
anova(lm.fit, lm.fit2) # 查看两种方式的区别
Res.Df
RSS
Df
Sum of Sq
F
Pr(>F)
504
19472.38
NA
NA
NA
NA
503
15347.24
1
4125.138
135.1998
7.630116e-28
par(mfrow=c(2,2))
plot(lm.fit2)
lm.fit5 = lm(medv~poly(lstat,5)) # 5阶多项式
summary(lm.fit5)
Call:
lm(formula = medv ~ poly(lstat, 5))
Residuals:
Min 1Q Median 3Q Max
-13.5433 -3.1039 -0.7052 2.0844 27.1153
Coefficients:
Estimate Std. Error t value Pr(>|t|)
(Intercept) 22.5328 0.2318 97.197 < 2e-16 ***
poly(lstat, 5)1 -152.4595 5.2148 -29.236 < 2e-16 ***
poly(lstat, 5)2 64.2272 5.2148 12.316 < 2e-16 ***
poly(lstat, 5)3 -27.0511 5.2148 -5.187 3.10e-07 ***
poly(lstat, 5)4 25.4517 5.2148 4.881 1.42e-06 ***
poly(lstat, 5)5 -19.2524 5.2148 -3.692 0.000247 ***
---
Signif. codes: 0 '***' 0.001 '**' 0.01 '*' 0.05 '.' 0.1 ' ' 1
Residual standard error: 5.215 on 500 degrees of freedom
Multiple R-squared: 0.6817,Adjusted R-squared: 0.6785
F-statistic: 214.2 on 5 and 500 DF, p-value: < 2.2e-16
summary(lm(medv~log(rm),data = Boston)) # 对数变换
Call:
lm(formula = medv ~ log(rm), data = Boston)
Residuals:
Min 1Q Median 3Q Max
-19.487 -2.875 -0.104 2.837 39.816
Coefficients:
Estimate Std. Error t value Pr(>|t|)
(Intercept) -76.488 5.028 -15.21 <2e-16 ***
log(rm) 54.055 2.739 19.73 <2e-16 ***
---
Signif. codes: 0 '***' 0.001 '**' 0.01 '*' 0.05 '.' 0.1 ' ' 1
Residual standard error: 6.915 on 504 degrees of freedom
Multiple R-squared: 0.4358,Adjusted R-squared: 0.4347
F-statistic: 389.3 on 1 and 504 DF, p-value: < 2.2e-16
定性预测变量
fix(Carseats)
names(Carseats)
'Sales'
'CompPrice'
'Income'
'Advertising'
'Population'
'Price'
'ShelveLoc'
'Age'
'Education'
'Urban'
'US'
lm.fit = lm(Sales~.+Income:Advertising + Price:Age, data = Carseats)
summary(lm.fit)
Call:
lm(formula = Sales ~ . + Income:Advertising + Price:Age, data = Carseats)
Residuals:
Min 1Q Median 3Q Max
-2.9208 -0.7503 0.0177 0.6754 3.3413
Coefficients:
Estimate Std. Error t value Pr(>|t|)
(Intercept) 6.5755654 1.0087470 6.519 2.22e-10 ***
CompPrice 0.0929371 0.0041183 22.567 < 2e-16 ***
Income 0.0108940 0.0026044 4.183 3.57e-05 ***
Advertising 0.0702462 0.0226091 3.107 0.002030 **
Population 0.0001592 0.0003679 0.433 0.665330
Price -0.1008064 0.0074399 -13.549 < 2e-16 ***
ShelveLocGood 4.8486762 0.1528378 31.724 < 2e-16 ***
ShelveLocMedium 1.9532620 0.1257682 15.531 < 2e-16 ***
Age -0.0579466 0.0159506 -3.633 0.000318 ***
Education -0.0208525 0.0196131 -1.063 0.288361
UrbanYes 0.1401597 0.1124019 1.247 0.213171
USYes -0.1575571 0.1489234 -1.058 0.290729
Income:Advertising 0.0007510 0.0002784 2.698 0.007290 **
Price:Age 0.0001068 0.0001333 0.801 0.423812
---
Signif. codes: 0 '***' 0.001 '**' 0.01 '*' 0.05 '.' 0.1 ' ' 1
Residual standard error: 1.011 on 386 degrees of freedom
Multiple R-squared: 0.8761,Adjusted R-squared: 0.8719
F-statistic: 210 on 13 and 386 DF, p-value: < 2.2e-16
# R语言自动将定性变量转变为虚拟变量,并通过contrasts()返回虚拟变量的编码
attach(Carseats)
contrasts(ShelveLoc)
Good
Medium
Bad
0
0
Good
1
0
Medium
0
1
编写函数`
LoadLibraries = function(){
library(ISLR)
library(MASS)
print("The libraries have been loaded.")
}
LoadLibraries # 查看函数内容
function ()
{
library(ISLR)
library(MASS)
print("The libraries have been loaded.")
}
LoadLibraries() # 调用函数
[1] "The libraries have been loaded."
