【机器学习】KS值
KS检验-风控角度
分类模型评判指标 - KS曲线与KS值
从统计角度,我们知道KS是分析两组数据分布是否相同的检验指标。在金融领域中,我们的y值和预测得到的违约概率刚好是两个分布未知的两个分布。好的信用风控模型一般从准确性、稳定性和可解释性来评估模型。
一般来说。好人样本的分布同坏人样本的分布应该是有很大不同的,KS正好是有效性指标中的区分能力指标:KS用于模型风险区分能力进行评估,KS指标衡量的是好坏样本累计分布之间的差值。好坏样本累计差异越大,KS指标越大,那么模型的风险区分能力越强。
横轴:阈值or数据集百分比
纵轴:TPR(真正率)与FPR(假正率)
实现:
def compute_ks(data1,data2):
    df1 = DataFrame()
    df1['pred'] = data2
    df1['label'] = data1
    # 按照样本为正样本的概率值升序排序,也即坏样本的概率从高到低排序
    sorted_list = df1.sort_values(['pred'], ascending=[True])
    # print(sorted_list)
    """
      pred     label
17  0.055966    0.0
8   0.056266    0.0
14  0.063441    0.0
15  0.066217    0.0
0   0.070942    0.0
4   0.074102    0.0
3   0.087055    0.0
2   0.090387    0.0
18  0.092003    1.0
6   0.098286    0.0
16  0.105280    0.0
10  0.107256    0.0
12  0.123415    0.0
5   0.137829    0.0
7   0.139731    0.0
1   0.159905    0.0
13  0.180385    0.0
9   0.203199    0.0
11  0.217903    0.0
    """
    total_good = sorted_list['label'].sum() # label为1的样本有多少个,真实为1的样本
    # print(sorted_list['label'])
    # print(total_good)
    total_bad = sorted_list.shape[0] - total_good # label为0的样本有多少个,真实为0的样本

    max_ks = 0.0
    good_count = 0.0
    bad_count = 0.0
    for index, row in sorted_list.iterrows(): #按照标签和每行拆开
        # print(index)
        # print('-'*5)
        # print(row)
        """
        index: 17
        row:
            pred     0.055966
            label    0.000000
        """
        if row['label'] == 0:
            bad_count += 1
        else:
            good_count += 1
        val = abs(bad_count/total_bad - good_count/total_good)
        max_ks = max(max_ks, val)
    return max_ks


def cal_auc(labels, preds):
    """
    先排序,然后统计有多少正负样本对满足:正样本预测值>负样本预测值, 再除以总的正负样本对个数
    复杂度 O(NlogN), N为样本数
    """
    n_pos = sum(labels)
    n_neg = len(labels) - n_pos
    total_pair = n_pos * n_neg

    labels_preds = zip(labels, preds)
    labels_preds = sorted(labels_preds, key=lambda x: x[1])
    accumulated_neg = 0
    satisfied_pair = 0
    for i in range(len(labels_preds)):
        if labels_preds[i][0] == 1:
            satisfied_pair += accumulated_neg
        else:
            accumulated_neg += 1

    return satisfied_pair / float(total_pair)

def approximate_auc(labels, preds, n_bins=100):
    """
    近似方法,将预测值分桶(n_bins),对正负样本分别构建直方图,再统计满足条件的正负样本对
    复杂度 O(N)
    这种方法有什么缺点?怎么分桶?

    """
    n_pos = sum(labels)
    n_neg = len(labels) - n_pos
    total_pair = n_pos * n_neg

    pos_histogram = [0 for _ in range(n_bins)]
    neg_histogram = [0 for _ in range(n_bins)]
    bin_width = 1.0 / n_bins
    for i in range(len(labels)):
        nth_bin = int(preds[i] / bin_width)
        if labels[i] == 1:
            pos_histogram[nth_bin] += 1
        else:
            neg_histogram[nth_bin] += 1

    accumulated_neg = 0
    satisfied_pair = 0
    for i in range(n_bins):
        satisfied_pair += (pos_histogram[i] * accumulated_neg + pos_histogram[i] * neg_histogram[i] * 0.5)
        accumulated_neg += neg_histogram[i]

    return satisfied_pair / float(total_pair)
掉包侠的结果好像是错的,逃不掉自己写
# official
def calc_ks(y_true, y_prob, n_bins=10):
    percentile = np.linspace(0, 100, n_bins + 1).tolist()
    bins = [np.percentile(y_prob, i) for i in percentile]
    bins[0] = bins[0] - 0.01
    bins[-1] = bins[-1] + 0.01
    binids = np.digitize(y_prob, bins) - 1
    y_1 = sum(y_true == 1)
    y_0 = sum(y_true == 0)
    bin_true = np.bincount(binids, weights=y_true, minlength=len(bins))
    bin_total = np.bincount(binids, minlength=len(bins))
    bin_false = bin_total - bin_true
    true_pdf = bin_true / y_1
    false_pdf = bin_false / y_0
    true_cdf = np.cumsum(true_pdf)
    false_cdf = np.cumsum(false_pdf)
    ks_list = np.abs(true_cdf - false_cdf).tolist()
    ks = max(ks_list)
    return ks


# 在网上看其他人实现的方案,但是感觉是错的,和我们的问题可能有出入,
# 等之后再研究吧
from scipy.stats import ks_2samp
get_ks = lambda y_pred,y_true: ks_2samp(y_pred[y_true==1], y_pred[y_true!=1]).statistic
get_ks(x,y)
# mine
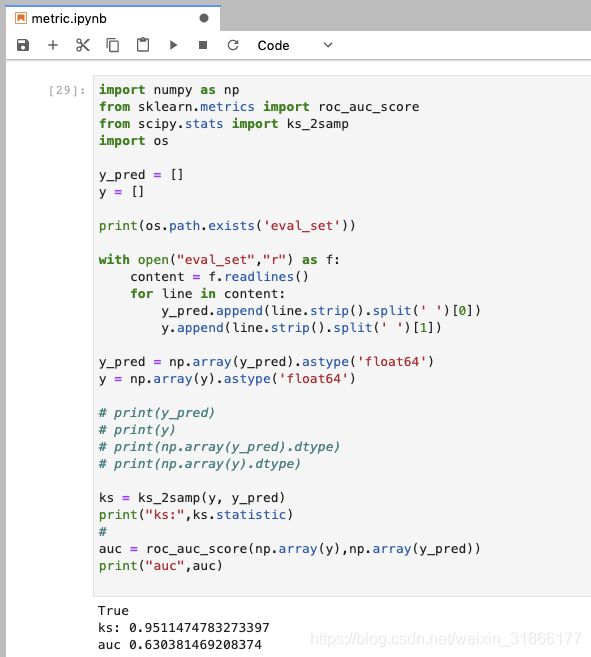
ks = ks_2samp(y, y_pred)
print("ks:",ks.statistic)
首先我们有一份样本数据,包含两个指标,1.label(0,1) 2.信用分(假定是0到5)
label指标属于原始数据,有过逾期的用户为0, bad clients; 信用一直良好的为1,good clients信用分为预测指标,模型输出数据(0到5)。
作为一个常识,我们应该知道信用分的分布应该符合正态分布,也就是说接近5的人和接近0的人应该是极少极少的,大部分都在2到4之间。
信用分是0到5,那现在想知道,如果我们要贷款给用户,那把钱贷给信用分为多少的人呢?
在选择这个值的时候,我们需要考虑是希望能把钱贷给尽可能多的好人和尽可能少的坏人。如果我们选择信用分大于4的人,也许确实能过滤掉大部分坏人,但好人也被过滤掉了,用户也就少了。
这个时候我们就需要ks值了。
下面解释ks值:
f(bad) 预测为负,真实为负除以所有真实负样本数。假正例率:
- FPRate的意义是所有真实类别为0的样本中,预测类别为1的比例。(好人为1)
f(good) 预测为负,真实为正除以所有真实正样本数。真正例率:
- TPRate的意义是所有真实类别为1的样本中,预测类别为1的比例。(坏人为0)
这里的负指的是bad clients,也就是逾期用户。而我们的目标就是希望找到一个值,区分bad和good用户,使f(bad)尽可能大,f(good)尽可能小。
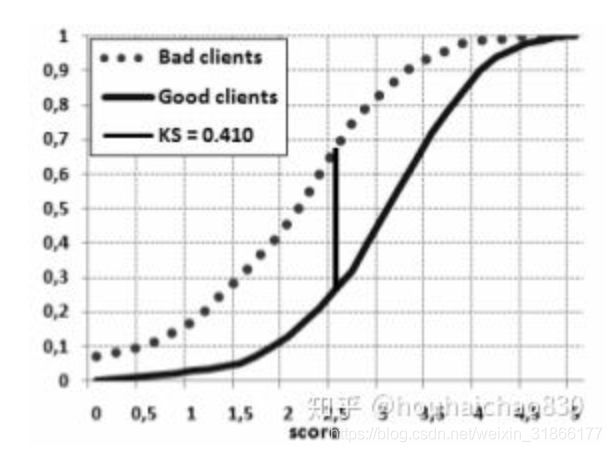
可以画出如下类似的图:
横坐标代表信用分,纵坐标代表比率。 两条曲线分别是f(bad) 和 f(good)
极端情况下,我们假设信用分小于5的都是坏人,这样所有的人都是坏人了f(bad)=1了,但f(good)=1(也就是右上角的两个点),表明模型还是很不好的,把好人也当坏人了。 而ks值在这里恰好可以找到一个信用分点,满足上述的条件:f(bad)大,f(good)小。
如图所示,在横坐标2.5处,找到了我们的ks值0.4,在这个点我们找到了70%的真实坏人,而且只把30%的好人误认为是坏人了。 ks=70% - 30%; 相对于其它点来说已经是最好的了。
所以,ks值是越大越好的,再考虑极端情况,如果有模型能找到所有的坏人(也就是f(bad)=100%),并且没有误判任何一个好人f(good)=0,那么它的ks值就=1了,属于完美模型了。 当然,对于风控模型,因为信用分几乎都符合正态分布,是不可能出现这种情况的,也只能说越大越好。
def ks_2samp(data1, data2):
    """
    Computes the Kolmogorov-Smirnov statistic on 2 samples.
    This is a two-sided test for the null hypothesis that 2 independent samples
    are drawn from the same continuous distribution.

功能:计算ks值,输出对应分割点和累计分布函数曲线图
输入值:
data: 而为数组或dataframe,包括模型得分和真实的标签
score_col:一维数组或series,代表模型得分(一般为预测正类的概率)
class_col:一维数组或series,代表真实的标签((0,1)or(-1,1))
输出值:
ks:ks值
cdf_df:好坏人累积概率分布以及其差值gap

    Parameters
    ----------
    data1, data2 : sequence of 1-D ndarrays
        two arrays of sample observations assumed to be drawn from a continuous
        distribution, sample sizes can be different
    Returns
    -------
    statistic : float
        KS statistic
    pvalue : float
        two-tailed p-value
    Notes
    -----
    This tests whether 2 samples are drawn from the same distribution. Note
    that, like in the case of the one-sample K-S test, the distribution is
    assumed to be continuous.
    This is the two-sided test, one-sided tests are not implemented.
    The test uses the two-sided asymptotic Kolmogorov-Smirnov distribution.
    If the K-S statistic is small or the p-value is high, then we cannot
    reject the hypothesis that the distributions of the two samples
    are the same.
    Examples
    --------
    >>> from scipy import stats
    >>> np.random.seed(12345678)  #fix random seed to get the same result
    >>> n1 = 200  # size of first sample
    >>> n2 = 300  # size of second sample
    For a different distribution, we can reject the null hypothesis since the
    pvalue is below 1%:
    >>> rvs1 = stats.norm.rvs(size=n1, loc=0., scale=1)
    >>> rvs2 = stats.norm.rvs(size=n2, loc=0.5, scale=1.5)
    >>> stats.ks_2samp(rvs1, rvs2)
    (0.20833333333333337, 4.6674975515806989e-005)
    For a slightly different distribution, we cannot reject the null hypothesis
    at a 10% or lower alpha since the p-value at 0.144 is higher than 10%
    >>> rvs3 = stats.norm.rvs(size=n2, loc=0.01, scale=1.0)
    >>> stats.ks_2samp(rvs1, rvs3)
    (0.10333333333333333, 0.14498781825751686)
    For an identical distribution, we cannot reject the null hypothesis since
    the p-value is high, 41%:
    >>> rvs4 = stats.norm.rvs(size=n2, loc=0.0, scale=1.0)
    >>> stats.ks_2samp(rvs1, rvs4)
    (0.07999999999999996, 0.41126949729859719)
    """
    data1 = np.sort(data1)
    data2 = np.sort(data2)
    n1 = data1.shape[0]
    n2 = data2.shape[0]
    data_all = np.concatenate([data1, data2])
    cdf1 = np.searchsorted(data1, data_all, side='right') / (1.0*n1)
    cdf2 = np.searchsorted(data2, data_all, side='right') / (1.0*n2)
    d = np.max(np.absolute(cdf1 - cdf2))
    # Note: d absolute not signed distance
    en = np.sqrt(n1 * n2 / float(n1 + n2))
    try:
        prob = distributions.kstwobign.sf((en + 0.12 + 0.11 / en) * d)
    except:
        prob = 1.0

    return Ks_2sampResult(d, prob)
在实际情况下,我们一般计算违约概率的ks值,这时是不存在NAN值的。所以以上三种方法计算ks值均可。但是当我们计算单变量的ks值时,有时数据质量不好,存在NAN值时,继续采用ks_calc_auc和ks_calc_2samp就会存在问题。
解决办法有两个 1. 提前去除数据中的NAN值 2. 直接采用ks_calc_cross计算。
参考:
houhaichao830
4.4.2分类模型评判指标(四) - ROC,AUC,GINI,KS,Lift,Gain,MSE总结
python绘制
auc和ks是强相关的指标
互联网金融:Vintage的应用
astype转成一样的浮点数才可以进行减法操作!!!要dtype查看,之前这里报错辽~?


