Matplotlib系列(三):坐标轴变换及注释
Matplotlib系列目录
文章目录
- 一、 简介
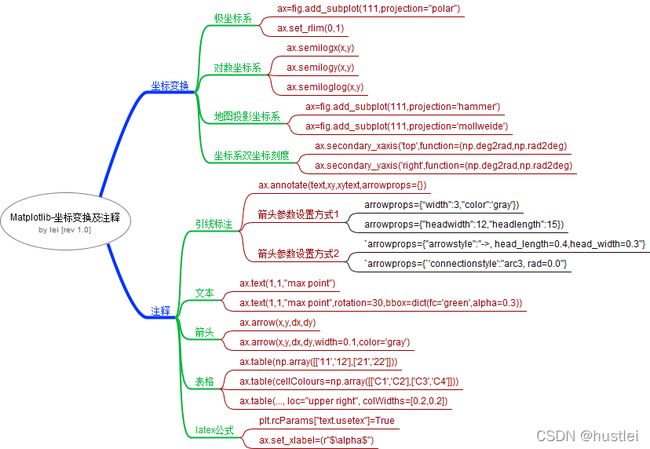
- 二、 思维导图
- 三、 坐标轴变换及注释
-
- 1. 坐标轴变换
-
- 1.1 极坐标系
- 1.2 对数坐标系
- 1.3 地图坐标系
- 1.4 坐标轴双坐标
- 2. 注释
-
- 2.1 引线标注
- 2.2 文本
- 2.3 箭头
- 2.4 表格
- 2.5 公式
一、 简介
matplotlib有强大的变换功能,并提供了预定义的极坐标、对数坐标等坐标系。
matplotlib还有丰富的文本和箭头注释功能,可以方便的在指定位置添加注释,并且注释文本支持latex公式。
Matplotlib系列将Matplotlib的知识和重点API,编制成思维导图和重点笔记形式,方便记忆和回顾,也方便应用时参考,初学者也可以参考逐步深入学习。
二、 思维导图
三、 坐标轴变换及注释
1. 坐标轴变换
matplotlib有强大的变换功能,但是通常我们不需要直接去写代码变换,常用的极坐标、对数坐标等有预设的方法。
1.1 极坐标系
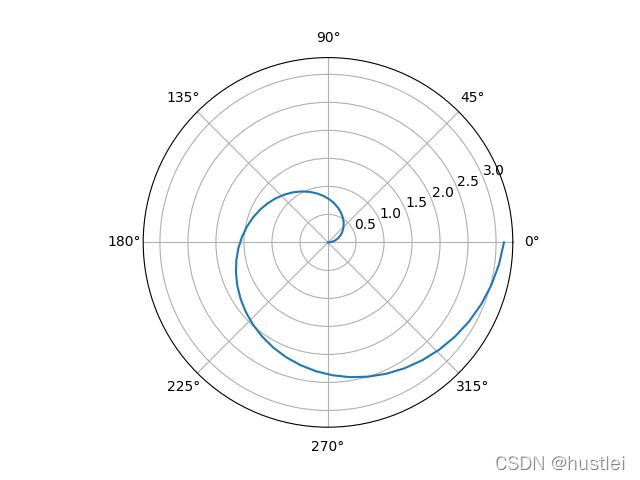
极坐标绘图需要在创建子图的时候设置参数projection="polar"。
示例如下:
import numpy as np
import matplotlib.pyplot as plt
fig = plt.figure()

ax=fig.add_subplot(111, projection="polar")
theta=np.linspace(0, np.pi*2, 50)
ax.plot(theta, theta/2)

plt.show()
注意fig.subplots函数不支持projection参数。
极坐标显示设置
- 极轴坐标最大、最小值设置
ax.set_rlim(0.5,1):经向坐标范围为0.5至1。相当于同时使用set_rmax,set_rminax.set_rmax(1):设置经向最大坐标值为1ax.set_rmin(0.5):设置经向最小坐标值为0.5
- 极轴坐标网格显示设置
ax.set_rgrids(np.arange(0, 1, 0.2)):设置经向网格ax.set_rticks(np.arange(0,0.8,0.2)):设置经向网格范围,与set_rgird完全相同
- 极轴坐标设置为对数坐标
ax.set_rscale('symlog'):设置为对数坐标。set_rscale(‘linear’)设置为线型坐标
- 极轴坐标刻度标签位置设置
ax.set_rlabel_position('90'):经向文本标签在90度反向位置显示
1.2 对数坐标系
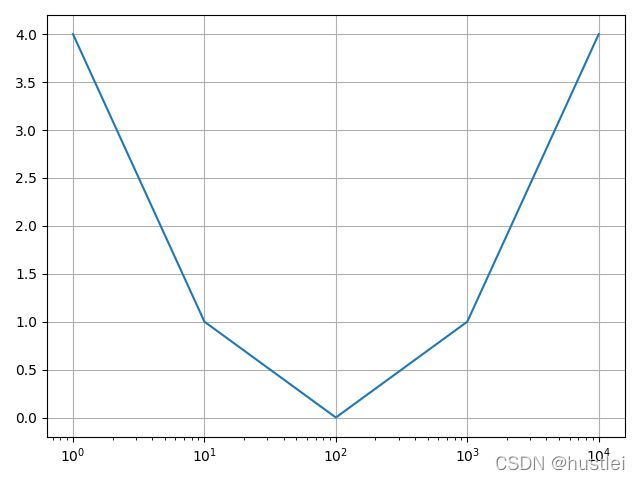
x轴为对数坐标
- ax.semilogx(x,y)
import numpy as np
import matplotlib.pyplot as plt
fig=plt.figure()
ax1=fig.subplots()

x=np.array([1,10,100,1000,10000])
y=(np.log10(x)-2)**2
ax1.semilogx(x,y)

ax1.grid(True)
fig.tight_layout()
plt.show()
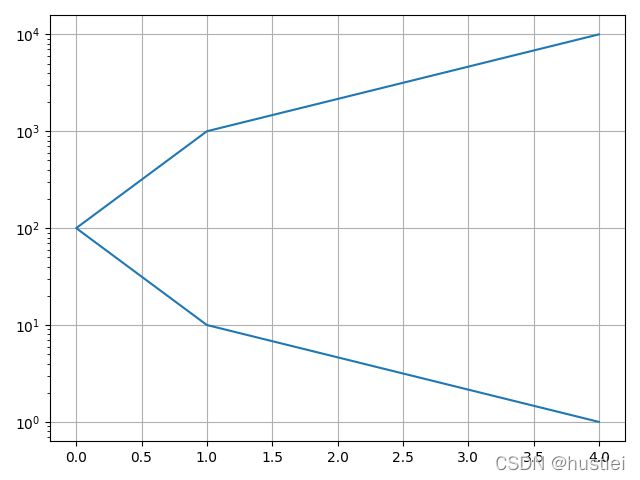
y轴为对数坐标
- ax.semilogy(x,y)
import numpy as np
import matplotlib.pyplot as plt
fig=plt.figure()
ax1=fig.subplots()

y=np.array([1,10,100,1000,10000])
x=(np.log10(x)-2)**2
ax1.semilogy(x,y)

ax1.grid(True)
fig.tight_layout()
plt.show()
x,y轴同为对数坐标
import numpy as np
import matplotlib.pyplot as plt
fig=plt.figure()
ax1=fig.subplots()

y=np.array([1,10,100,1000,10000])
x=y
ax1.loglog(x,y)

ax1.grid(True)
plt.show()
1.3 地图坐标系
matplotlib提供了世界地图投影坐标系。共四种:
- ‘aitoff’:埃托夫投影。用椭圆(轴比2:1)显示世界地图。
- 是一种方位等距投影。采用椭圆形经纬网的折衷投影。
- 适用于绘制小比例的世界地图。
- 经度范围是从-pi到pi,纬度范围是从-pi/2到pi/2。
- ‘hammer’:汉莫尔投影。用椭圆(轴比2:1)显示世界地图。也称为“aitoff-hammer”投影。
- 是兰伯特等面积投影的改良型投影。是等面积投影,其经纬网都是椭圆形。
- 适用于绘制小比例地图。
- ‘mollweide’:摩尔维特投影。用椭圆(轴比2:1)显示世界地图。
- 是一种等面积伪圆柱投影。形状、方向、角度和距离一般都会发生畸变。
- 适用于需要精确面积的专题世界地图。
- 经度范围是从-pi到pi,纬度范围是从-pi/2到pi/2。
- ‘lambert’:圆形地图投影
- 经度范围是从(-pi,pi),纬度范围是从-pi到pi。
地图投影区别详见ArcGIS地图投影
import numpy as np
import matplotlib.pyplot as plt

fig=plt.figure()
ax1=fig.add_subplot(221, projection='aitoff')
ax2=fig.add_subplot(222, projection='hammer')
ax3=fig.add_subplot(223, projection='mollweide')
ax4=fig.add_subplot(224, projection='lambert')

x=np.linspace(-np.pi,np.pi,200)  #经度-π~π(-180~180)
y=np.sin(x)                                #纬度-π/2~π/2(-90~90)

ax1.plot(x,y)
ax2.plot(x,y)
ax3.plot(x,y)
ax4.plot(x,y)

ax1.grid(True)
ax2.grid(True)
ax3.grid(True)
ax4.grid(True)

fig.tight_layout()
plt.show()
1.4 坐标轴双坐标
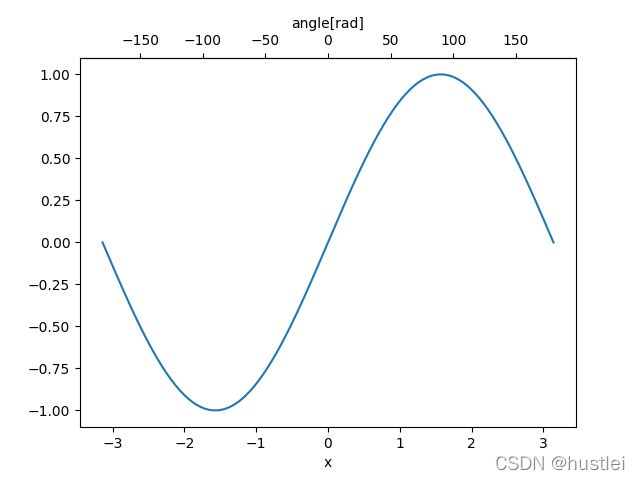
matplotlib支持为x轴,y轴设置第二个坐标刻度。
ax.secondary_xaxis('top', functions=(f1,f2)):为x轴设置第二坐标刻度ax.secondary_xaxis('right',functions=(f1,f2)):为y轴设置第二坐标刻度- 第一个参数为显示位置,必须设置。
- 第二个参数为变换函数。f1为当前坐标变换到第二坐标的函数。f2为f1的反向
示例如下:
import numpy as np
import matplotlib.pyplot as plt

fig=plt.figure()
ax=fig.subplots()

x=np.linspace(-np.pi,np.pi,200)
y=np.sin(x)
ax.plot(x,y)
ax.set_xlabel('x')

xaxis2=ax.secondary_xaxis('top', functions=(np.rad2deg,np.deg2rad)) #设置x轴第二坐标
xaxis2.set_xlabel('angle[rad]')

plt.show()
2. 注释
2.1 引线标注
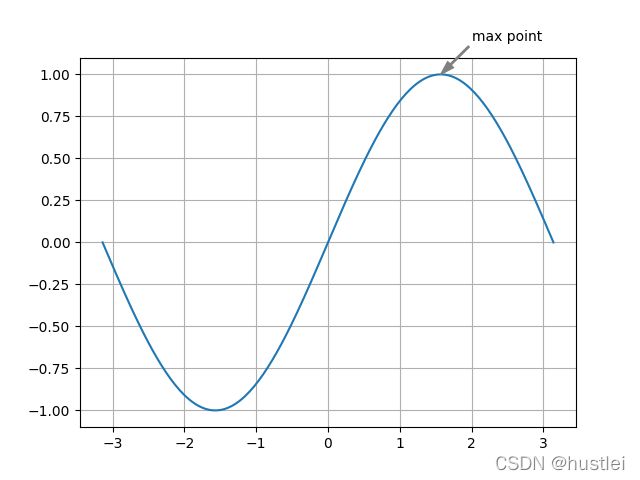
ax.annotate(text,xy,xytext,arrowprops={}):为xy坐标处设置标注,文字位于xytext坐标。- xytext参数不存在时,默认文本位于xy坐标
- arrowprops参数:设置箭头绘制参数,arrowprops是字典。
- 箭头指向xy坐标,箭头尾部位于xytext坐标。
- 默认值是None,即不显示箭头。赋值为空字典{},就可以显示默认样式的箭头。
引线箭头参数设置
annotate引线箭头参数有两种设置方式:
1)简单方式
arrowprops={}):使用默认值绘制箭头arrowprops={"width":3}):设置箭头线条宽度,默认宽度为3arrowprops={"headwidth":12,"headlength":15}):设置箭头三角形长宽,默认都是12arrowprops={"shrink":0.1}):箭头线条长度缩短0.1arrowprops={"color":'gray'}):箭头线条长度缩短0.1
arrowprops参数中字典内的key可以任意组合。
ax1.annotate("max point", (np.pi/2,1), xytext=(2,1.2),
        #arrowprops={})  #使用默认值绘制箭头
        #arrowprops={"width":3})  #设置箭头线条宽度,默认宽度为3
        #arrowprops={"headwidth":12,"headlength":15})  #设置箭头三角形长宽,默认都是12
        #arrowprops={"shrink":0.1})  #箭头线条长度缩短0.1
        arrowprops={"width":1, "headwidth":6,"headlength":10,"color":"gray"})
2)高级方式
高级方式arrowprops字典的key可选选项的更多,可以组合出更加华丽的样式。常用的key如下:
- 箭头样式
"arrowstyle":"-":样式设置,可选样式很多"-":线条,只有引线"<-","->","<->":单向箭头和双向箭头"<|-","-|>","<|-|>":有填充颜色的箭头"Simple","fancy","wedge":简单箭头,尾部变宽凹成v型箭头,长三角形
- “<-”,"-|>"等都还可有参数
head_length=0.4, head_width=0.2, widthA=1.0, widthB=1.0, lengthA=0.2, lengthB=0.2- "simple"和"fancy"具有参数:
head_length=0.5, head_width=0.5, tail_width=0.2- "wedge"具有参数:tail_width=0.3, shrink_factor=0.5
用法示例:
arrowprops={"arrowstyle":"->, head_length=0.4,head_width=0.3"}arrowprops={"arrowstyle":"fancy,tail_width=0.5"}
- 箭头引线样式
'connectionstyle':"arc3, rad=0.0":弧形'connectionstyle':"angle3, angleA=90, angleB=0":贝塞尔曲线
- 其他关键字
- ‘color’:颜色
- ‘facecolor’ or ‘fc’:填充色
- ‘edgecolor’ or ‘ec’:边缘色
- ‘fill’:bool,是否填充
- ‘aplpha’:透明度
- ‘linestyle’ or ‘ls’:线型
- ‘linewidth’ or ‘lw’:线宽
示例:
import numpy as np
import matplotlib.pyplot as plt

fig=plt.figure()
ax1=fig.subplots()
x=np.linspace(-np.pi,np.pi,200)
y=np.sin(x)
ax1.plot(x,y)

ax1.annotate("max point",  (np.pi/2,1), xytext=(1.5,0.5),
        arrowprops={"arrowstyle":"fancy, tail_width=0.5",
                    'connectionstyle':'arc3, rad=-0.2',
                    'fill':True, 'ec':'gray',
                    'fc':'lightblue', 'alpha':0.5})

ax1.grid(True)
plt.show()
2.2 文本
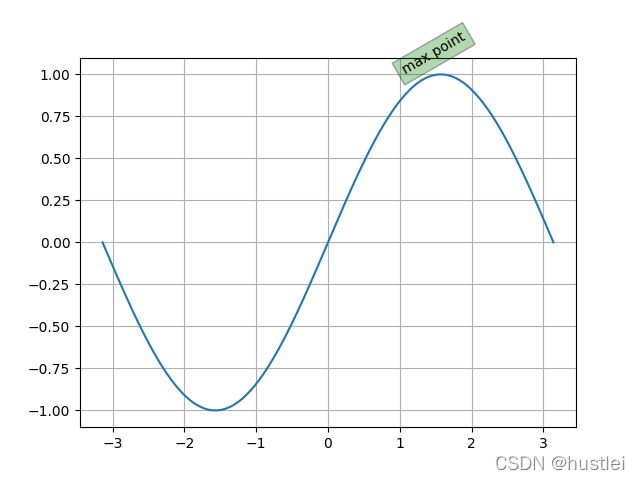
ax.text(x,y,s):把文本s绘制到坐标x,y处。- 字体设置参数
fontfamily=['simhei','serif']:字体参数fontsize=14:字号参数fontstyle='italic':是否斜体fontweight=500:取值0-1000或者"light",“normal”,"bold"等
rotation=30:旋转角度bbox={'facecolor':'r','alpha':0.3}:设置方框及填充颜色
- 字体设置参数
ax.text(1,1,"max point",rotation=30,bbox=dict(fc='green',alpha=0.3))
2.3 箭头
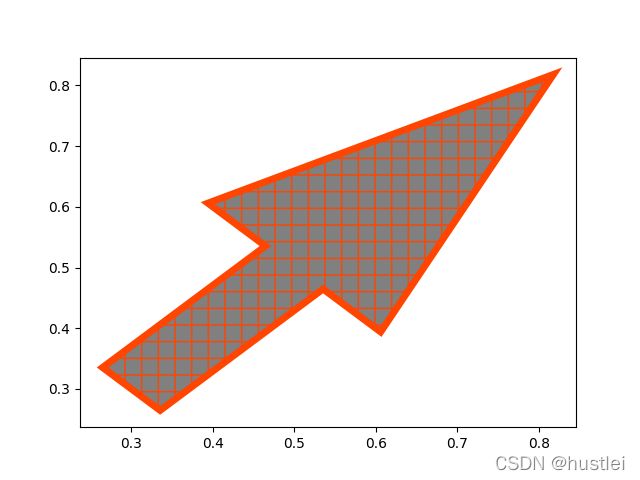
在指定位置绘制箭头,可用于特别的注释或者公式、流程等。
ax.arrow(x,y,dx,dy):绘制从x,y指向(x+dx,y+dy)的箭头- 箭头箭杆尺度参数
head_width=3*width:箭头宽度head_length=1.5*head_width:箭头长度width=0.001:箭杆宽度。单位和坐标轴刻度相同
- 颜色参数
color='gray':设置颜色facecolor='gray':or fc设置填充颜色edgecolor='gray':or ec设置边缘颜色alpha=0.5:透明度
- 形状参数
fill=True:是否填充色块(颜色有fc决定)hatch='/':图案填充(与fill无关,颜色由ec决定)'/', '\', '|', '-':平行线条'+', 'x':网格'o', 'O', '.', '*':点
- 边缘线条
linestyle='--':箭头边缘线条样式linewidth=5:箭头边缘线条跨度。单位是像素。
- 箭头箭杆尺度参数
ax.arrow(0.3,0.3,0.2,0.2,         #箭头位置0.3,0.3到0.5,0.5
        width=0.1,                #箭杆宽度
        fill=True,fc='gray',      #填充色
        lw=5,ec='orangered',      #边缘线条
        hatch='+')                #图案填充,颜色为ec
2.4 表格
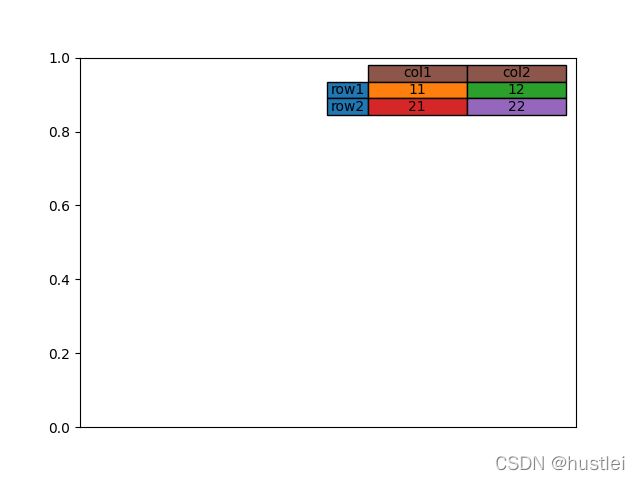
在指定位置绘制表格。
ax.table(np.array([['11','12'],['21','22']])):2维数组文本绘制为表格ax.table(cellColours=np.array([['C1','C2'],['C3','C4']])):绘制表格,填充对应颜色。
table函数必须有文本参数或者cellColours参数。
- ax.table函数常用参数(可选)
loc='bottom':默认在x轴下方- ‘best’: 0, ‘left’: 15, ‘right’: 14, ‘bottom’: 17, ‘top’: 16, ‘center’: 9
'bottom left': 12, 'bottom right': 13:外部下方'top left': 11, 'top right': 10:外部上方'center left': 5, 'center right': 6:内部'lower center': 7, 'lower left': 3, 'lower right': 4:内部下方'upper center': 8, 'upper left': 2, 'upper right': 1:内部上方
cellLoc='right':单元格内文本对齐方式- ‘left’, ‘center’, ‘right’
colWidths=[1,1]:列宽度,单位和坐标轴相同。不设置的话,表格宽度和坐标轴相同rowLabels=['row1','row2']:行标题colLabels=['col1','col2']:列标题colColours, rowColours:分别设置列标题、行标题颜色。
ax.table([['11','12'],['21','22']],
            cellColours=[['C1','C2'],['C3','C4']],
            loc="upper right",
            colWidths=[0.2,0.2],
            cellLoc="center",
            rowLabels=['row1','row2'],
            colLabels=['col1','col2'],
            rowColours=['C0','C0'],
            colColours=['C5','C5'])
ax.set_xticks([])
2.5 公式
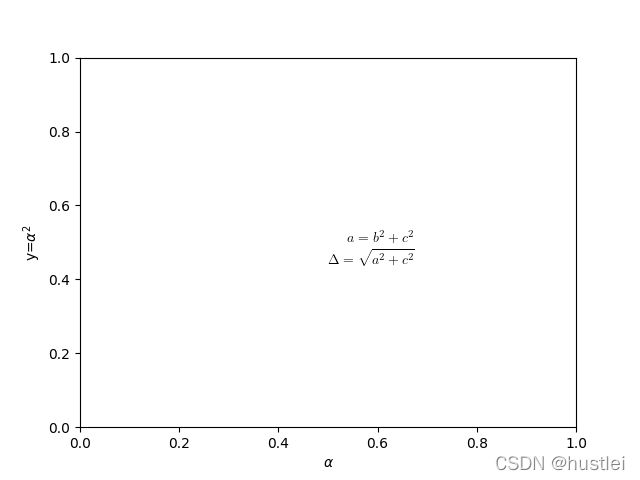
设置rcParams["text.usetex"]=True后,可以在文本中使用latex公式。
- 在显示文本的地方都可以使用latex,比如xlabel,title,text
- 可以在字符串中嵌入行内公式,比如
ax.set_title(r'equation $a=b^2$')
import numpy as np
import matplotlib.pyplot as plt
fig=plt.figure()
ax=fig.subplots()

plt.rcParams["text.usetex"]=True
ax.set_xlabel(r"$\alpha$")
ax.set_ylabel(r"y=$\alpha^2$")

eq=(r"\begin{eqnarray*}"
    r"a=b^2+c^2 \\"
    r"\Delta=\sqrt{a^2+c^2} \\"
    r"\end{eqnarray*}")
ax.text(0.5,0.5,eq)

plt.show()
第一次使用latex可能会比较慢,并且可能会提醒安装库。
Matplotlib系列目录
个人总结,部分内容进行了简单的处理和归纳,如有谬误,希望大家指出,持续修订更新中。
修订历史版本见:https://github.com/hustlei/AI_Learning_MindMap
未经允许请勿转载。
