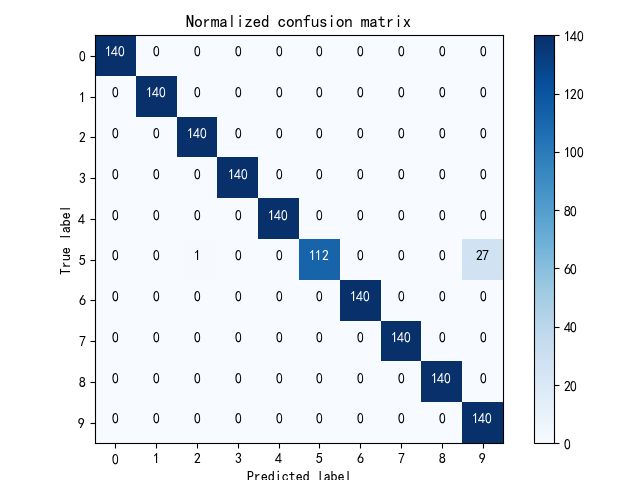
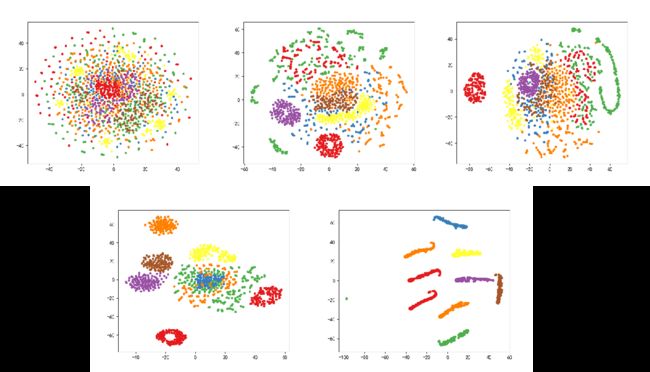
论文中常见的混淆矩阵和T-SNE聚类图
论文中要经常用到一些可视化的图,混淆矩阵和T-SNE比较常见,具体原理就不多说了,首先是模型代码,选个比较基础的,一共17层:
def CNN_1D():
    inputs1 = Input(shape=(2048, 1))
    conv1 = Conv1D(filters=16, kernel_size=6, strides=2)(inputs1)
    BN1 = BatchNormalization()(conv1)
    act1 = Activation('relu')(BN1)
    pool1 = MaxPooling1D(pool_size=2, strides=2)(act1)
    conv4 = Conv1D(filters=24, kernel_size=3, padding='same')(pool1)
    BN2 = BatchNormalization()(conv4)
    act2 = Activation('relu')(BN2)
    pool2 = MaxPooling1D(pool_size=2, strides=2)(act2)
    conv6 = Conv1D(filters=36, kernel_size=3, padding='same',
                   activation='relu')(pool2)
    BN3 = BatchNormalization()(conv6)
    act3 = Activation('relu')(BN3)
    pool3 = MaxPooling1D(pool_size=2, strides=2)(act3)
    flat1 = Flatten()(pool3)
    dense1 = Dense(100)(flat1)
    BN4 = BatchNormalization()(dense1)
    # drop1 = Dropout(0.4)(BN4)
    outputs = Dense(10, activation='softmax')(BN4)
    model = Model(inputs=inputs1, outputs=outputs)
    return model
先运行后保存模型参数便于读取。
首先绘制混淆矩阵
将预标签和真实标签输入绘图函数,函数如下:
def plot_confusion_matrix(cm, classes, normalize=False, title='Confusion matrix', cmap=plt.cm.Blues):  # 生成混淆矩阵图
    """
    - cm : 计算出的混淆矩阵的值
    - classes : 混淆矩阵中每一行每一列对应的列
    - normalize : True:显示百分比, False:显示个数
    """
    if normalize:
        cm = cm.astype('float') / cm.sum(axis=1)[:, np.newaxis]
        print("显示百分比:")
        np.set_printoptions(formatter={'float': '{: 0.2f}'.format})
        print(cm)
    else:
        print('显示具体数字:')
        print(cm)
    plt.imshow(cm, interpolation='nearest', cmap=cmap)
    plt.title(title)
    plt.colorbar()
    tick_marks = np.arange(len(classes))
    plt.xticks(tick_marks, classes)
    plt.yticks(tick_marks, classes)

    plt.ylim(len(classes) - 0.5, -0.5)
    fmt = '.2f' if normalize else 'd'
    thresh = cm.max() / 2.
    for i, j in itertools.product(range(cm.shape[0]), range(cm.shape[1])):
        plt.text(j, i, format(cm[i, j], fmt),
                 horizontalalignment="center",
                 color="white" if cm[i, j] > thresh else "black")
    plt.tight_layout()
    plt.ylabel('True label')
    plt.xlabel('Predicted label')
    plt.show()


def show_matrix(y_pred, y_true):
    C = confusion_matrix(y_true, y_pred, labels=['0', '1', '2', '3','4', '5', '6', '7','8', '9'])  # 可将'1'等替换成自己的类别,如'cat'。生成混淆矩阵

    # plt.matshow(C, cmap=plt.cm.Reds) # 按自己需求更改颜色
    # attack_types = ['正常', '内圈0.1778', '内圈0.3556','内圈0.5334','外圈0.1778', '外圈0.3556','外圈0.5334','滚动体0.1778','滚动体0.3556','滚动体0.5334']
    attack_types = ['0', '1', '2', '3','4', '5', '6', '7','8', '9']

    plot_confusion_matrix(C, classes=attack_types, normalize=False, title='Normalized confusion matrix')

def run_matrix(model,path,name):  # 显示预测结果的混淆矩阵

    dataDE_B = case10.data_DE_win(650, 'B', steps=128)

    score1, y_pred, y_true = model_matrix(dataDE_B, model, path, name)
    y_true = list(map(str, y_true))
    y_pred = list(map(str, y_pred))
    print('%.2f ' % (score1))
    show_matrix(y_pred, y_true)
结果如下:
然后是绘制T-SNE图
绘制关键的是将模型中指定层的特征张量提取出来,然后输入绘图的函数进行处理,先是提取特征
def model_tsne(base_data2, base_model, path, save_name,layers):
    _, _, _, _,testX1, testy1 = base_data2
    model = base_model
    model.compile(loss=tf.keras.losses.BinaryCrossentropy(from_logits=True),
                  optimizer=tf.keras.optimizers.Adam(lr=0.001),
                  metrics=['accuracy'])

    checkpoint_save_path = path + save_name + ".h5"
    model.load_weights(checkpoint_save_path)

    model0 = Model(inputs=model.input, outputs=model.get_layer(index=layers).output)
    feat_test1 = model0.predict(testX1)
    feat_test1 = feat_test1.reshape(feat_test1.shape[0], -1)
    feat_test1 = case10.BN(feat_test1)  #0-1标准化
    testy1 = np.argmax(testy1, axis=1)
    return feat_test1, testy1
而后将特征张量和标签输入到绘图函数中:
def show_tsne(data, label):
    X_tsne = TSNE(learning_rate=200, n_components=2, init='pca').fit_transform(data)
    # X_tsne = TSNE(learning_rate=100, n_components=2).fit_transform(data)
    # X_tsne = TSNE(n_components=2).fit_transform(data)
    plt.figure(figsize=(6, 5))
    # color = np.arange(2160)
    color = plt.cm.Set1(label / 13)  # 定义颜色的种类
    # plt.title('TSNE')
    plt.scatter(X_tsne[:, 0], X_tsne[:, 1], c=color,s=12)
    plt.show()

def tsne(model,layers):
    dataDE_B = case10.data_DE_win(650, 'B', steps=128)
    path = D:\\Users\\86158\\PycharmProjects\\pythonProject_tf2.0\\case_time\\papper\\checkpiont\\"
    name = "model1_CNN1"
    data1, label1= model_tsne(dataDE_B, model, path, name,layers)
    show_tsne(data1, label1)
指定不同的layers就能查看不同位置的聚类情况
劳动不易,需要代码的朋友可以点赞收藏关注三连后联系我。

