文章目录
- 一、数据清洗
- 二、数据分析
-
- 2.1 计算总体指标
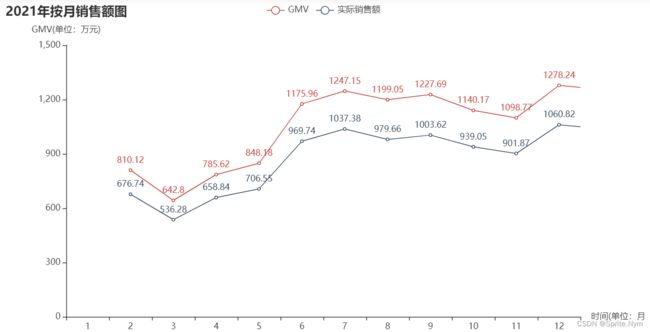
- 2.2 计算每月GMV及趋势分析
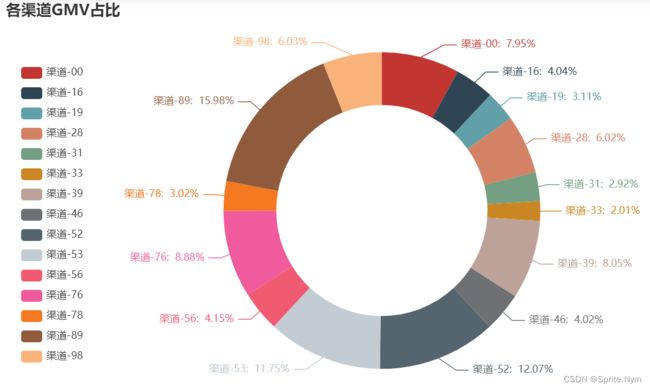
- 2.3 流量渠道来源拆解GMV占比
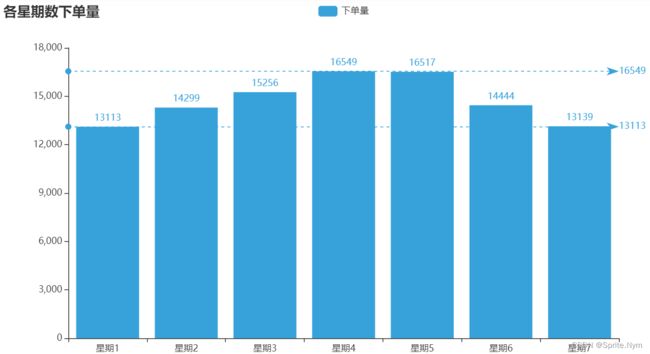
- 2.4 按星期几统计下单量
- 2.5 根据下单时段统计下单量(30分钟一段)
- 2.6 按月统计复购率
- 三、RFM模型
-
- 3.1 数据预处理
- 3.2 获取RFM等级分
- 3.3 用户分群
一、数据清洗
import numpy as np
import pandas as pd
import matplotlib.pyplot as plt
plt.rcParams['font.sans-serif'] = ['SimHei']
plt.rcParams['axes.unicode_minus'] = False
%config InlineBackend.figure_format = 'svg'
ec_df = pd.read_csv('datas/ecomm/某电商平台2021年订单数据.csv', index_col=0)
ec_df['orderTime'] = pd.to_datetime(ec_df['orderTime'])
ec_df['payTime'] = pd.to_datetime(ec_df['payTime'])
ec_df
ec_df = ec_df[ec_df['orderTime'].dt.year == 2021]
ec_df
ec_df = ec_df[(ec_df['payTime'] - ec_df['orderTime']).dt.total_seconds() <= 1800]
ec_df = ec_df[ec_df['payTime'] >= ec_df['orderTime']]
ec_df = ec_df[(ec_df['payment'] >= 0) & (ec_df['orderAmount'] >= 0)]
ec_df
ec_df['chanelID'] = ec_df['chanelID'].fillna(ec_df['chanelID'].mode()[0])
ec_df.info()
ec_df = ec_df.rename(columns={'chanelID': 'channelID', 'platfromType': 'platformType'})
ec_df
ser = ec_df['platformType'].replace(r'[\s·]', '', regex=True)
ser = ser.str.title()
ec_df['platformType'] = ser.replace(['薇信', 'Vx', '网页', '网站'],
['微信', '微信', 'Web', 'Web'])
temp_df = ec_df[ec_df['payment'] <= ec_df['orderAmount']]
mean_discount = (temp_df['payment'] / temp_df['orderAmount']).mean()
ec_df['payment'] = np.round(
ec_df['payment'].where(
ec_df['payment'] <= ec_df['orderAmount'],
ec_df['orderAmount'] * mean_discount
)
)
二、数据分析
2.1 计算总体指标
GMV = ec_df['orderAmount'].sum()
print(GMV)
all_payment = ec_df['payment'].sum()
print(all_payment)
true_payment = ec_df[ec_df['chargeback'] == False]['payment'].sum()
print(true_payment)
chargeback_ratio = f"{100 * len(ec_df[ec_df['chargeback']]) / len(ec_df):.2f}%"
print(chargeback_ratio)
ARPU = true_payment / ec_df['userID'].nunique()
print(ARPU)
2.2 计算每月GMV及趋势分析
ec_df['month'] = ec_df['orderTime'].dt.month
ec_df
temp_df = ec_df
temp_df['true_payment'] = temp_df['payment'].where(ec_df['chargeback'] == False, 0)
monthly_gmv = pd.pivot_table(temp_df, index='month', values=['orderAmount', 'true_payment'], aggfunc='sum')
monthly_gmv = monthly_gmv.applymap(lambda x: np.round(x/10000, 2))
import pyecharts.options as opts
from pyecharts.charts import Line
gmv_line = Line()
gmv_line.add_xaxis(monthly_gmv.index.to_list())
gmv_line.add_yaxis('GMV', monthly_gmv['orderAmount'].to_list())
gmv_line.add_yaxis('实际销售额', monthly_gmv['true_payment'].to_list())
gmv_line.set_global_opts(
title_opts=opts.TitleOpts(title="2021年按月销售额图"),
yaxis_opts=opts.AxisOpts(name='GMV(单位:万元)'),
xaxis_opts=opts.AxisOpts(name='时间(单位:月)')
)
gmv_line.render_notebook()

2.3 流量渠道来源拆解GMV占比
channel_gmv = pd.pivot_table(temp_df, index='channelID', values=['orderAmount'], aggfunc='sum')
channel_gmv = channel_gmv.applymap(lambda x: x/ 10000)
channel_gmv
from pyecharts.charts import Pie
channel_pie = Pie()
channel_pie.add(
'',
channel_gmv.reset_index().values.tolist(),
radius=["50%", "75%"]
)
channel_pie.set_global_opts(
title_opts=opts.TitleOpts(title="各渠道GMV占比"),
legend_opts=opts.LegendOpts(orient="vertical", pos_top="15%", pos_left="2%")
)
channel_pie.set_series_opts(label_opts=opts.LabelOpts(formatter="{b}: {d}%"))
channel_pie.render_notebook()

2.4 按星期几统计下单量
temp_df['weekday'] = temp_df['orderTime'].dt.weekday.map(lambda x: f'星期{x + 1}')
temp_df
weekday_count = pd.pivot_table(temp_df, index='weekday', values='orderID', aggfunc='nunique')
weekday_count
from pyecharts.charts import Bar
from pyecharts.globals import ThemeType
weekday_bar = Bar({"theme": ThemeType.LIGHT})
weekday_bar.add_xaxis(weekday_count.index.tolist())
weekday_bar.add_yaxis("下单量", weekday_count['orderID'].tolist())
weekday_bar.set_global_opts(title_opts=opts.TitleOpts(title="各星期数下单量"))
weekday_bar.set_series_opts(
label_opts=opts.LabelOpts(is_show=True),
markline_opts=opts.MarkLineOpts(
data=[
opts.MarkLineItem(type_="min", name="最小值"),
opts.MarkLineItem(type_="max", name="最大值")
]
),
)
weekday_bar.render_notebook()

2.5 根据下单时段统计下单量(30分钟一段)
temp_df['hour'] = temp_df['orderTime'].dt.floor('30T').dt.strftime('%H:%M')
temp_df
time_count = pd.pivot_table(temp_df, index='hour', values='orderID', aggfunc='nunique')
time_count
weekday_bar = Bar({"theme": ThemeType.ESSOS})
weekday_bar.add_xaxis(time_count.index.tolist())
weekday_bar.add_yaxis("下单量", time_count['orderID'].tolist())
weekday_bar.set_global_opts(
title_opts=opts.TitleOpts(title="各时段下单量"),
datazoom_opts=opts.DataZoomOpts()
)
weekday_bar.set_series_opts(
label_opts=opts.LabelOpts(is_show=True),
markline_opts=opts.MarkLineOpts(
data=[
opts.MarkLineItem(type_="min", name="最小值"),
opts.MarkLineItem(type_="max", name="最大值")
]
),
)
weekday_bar.render_notebook()

2.6 按月统计复购率
multiple_bought = pd.pivot_table(temp_df, index='userID', columns='month', values='orderID', aggfunc='nunique')
multiple_bought = multiple_bought.applymap(
lambda x: np.nan if np.isnan(x) else (
0 if x == 1 else 1
)
)
np.round(100 * multiple_bought.sum() / multiple_bought.count(), 2)
三、RFM模型
3.1 数据预处理
temp_df = pd.pivot_table(
ec_df[ec_df['chargeback'] == False],
index='userID',
values=['orderTime', 'orderID', 'payment'],
aggfunc={'orderTime': 'max', 'orderID': 'nunique', 'payment': 'sum'}
)
temp_df
from datetime import datetime
last_day = datetime(2021, 12, 31)
temp_df['orderTime'] = (last_day - temp_df['orderTime']).dt.days
temp_df
temp_df.rename(columns={'orderTime': 'R', 'orderID': 'F', 'payment': 'M'}, inplace=True)
temp_df = temp_df.reindex(columns=['R', 'F', 'M'])
temp_df
3.2 获取RFM等级分
temp_df['R_score'] = pd.cut(
temp_df['R'],
bins=[-1, 8, 31, 61, 121, 201, 365],
right=False,
labels=[6, 5, 4, 3, 2, 1]
).astype(np.int64)
temp_df['F_score'] = pd.cut(
temp_df['F'],
bins=[1, 2, 3, 4, 5, 6, 8],
right=False,
labels=[1, 2, 3, 4, 5, 6]
).astype(np.int64)
temp_df['M_score'] = pd.cut(
temp_df['M'],
bins=[0, 200, 500, 1000, 2000, 5000, 99999],
right=False,
labels=[1, 2, 3, 4, 5, 6]
).astype(np.int64)
3.3 用户分群
temp_df = (temp_df >= temp_df.mean()).applymap(lambda x: '1' if x else '0')
temp_df['tag'] = temp_df['R_score'] + temp_df['F_score'] + temp_df['M_score']
temp_df
def customer_type(tag):
if tag == '111':
return '重要价值客户'
elif tag == '101':
return '重要发展客户'
elif tag == '011':
return '重要保持用户'
elif tag == '001':
return '重要挽留用户'
elif tag == '110':
return '一般价值客户'
elif tag == '100':
return '一般发展客户'
elif tag == '010':
return '一般保持客户'
return '一般挽留客户'
temp_df['type'] = temp_df['tag'].map(customer_type)
temp_df
data = pd.pivot_table(temp_df, index='type', values='tag', aggfunc='count')
data = data.reset_index().values.tolist()
from pyecharts.charts import Pie
rfm_pie = Pie()
rfm_pie.add(
"",
data,
radius=["50%", "75%"]
)
rfm_pie.set_global_opts(
title_opts=opts.TitleOpts(title="RFM模型"),
legend_opts=opts.LegendOpts(orient="vertical", pos_top="15%", pos_left="2%"),
)
rfm_pie.set_series_opts(label_opts=opts.LabelOpts(formatter="{b}: {d}%"))
rfm_pie.render_notebook()


