数字滤波器的MATLAB与FPGA实现之读书笔记(一 混频器设计分析实例)
目录
第一章 设计语言及环境介绍
一、MATLAB 软件
1、MATLAB 常用信号产生函数演示示例
2、MATLAB 常用信号分析处理函数演示示例
3、快速傅里叶函数演示示例
4、混频器设计分析实例
第一章 设计语言及环境介绍
一、MATLAB 软件
1、MATLAB 常用信号产生函数演示示例
%E2_1_BasicWave.m文件源代码
%Matlab常用信号产生函数演示实例:编写一个M文件,依次产生均匀分布的随机序列、高斯白噪声随机序列、方波信号序列、三角波信号序列、正弦波信号序列,
%以及信噪比SNR为10dB的加性高斯白噪声正弦信号。

%产生方波、三角波及正弦波序列信号
%定义参数
Ps=10;       %正弦信号功率为10dBW
Pn=1;       %噪声信号功率为0dBW
f=100;       %信号频率为100Hz
Fs=1000;     %采样频率为1KHz
width=0.5;   %函数SAWTOOTH()的尺度参数为0.5
duty=50;     %函数SQUARE()的尺度参数为50
%产生信号
t=0:1/Fs:0.1;
c=2*pi*f*t;
sq=square(c,duty);%产生方波
tr=sawtooth(c,width);%产生三角波
si=sin(c);%产生正弦波

%产生随机序列信号
noi=rand(1,length(t));%产生均匀分布的随机序列
noise=randn(1,length(t));%产生高斯白噪声序列

%产生带有加性高斯白噪声的正弦信号序列
sin_noise=sqrt(2*Ps)*si+sqrt(Pn)*noise;
sin_noise=sin_noise/max(abs(sin_noise));%归一化处理

%画图
subplot(321); plot(t,noi);   axis([0 0.1 -1.1 1.1]);
xlabel('时间(s)','fontsize',8,'position',[0.08,-1.3,0]); ylabel('幅度(v)','fontsize',8);
title('均匀分布随机信号','fontsize',8);

subplot(322); plot(t,noise); axis([0 0.1 -max(abs(noise)) max(abs(noise))]);
xlabel('时间(s)','fontsize',8,'position',[0.08,-3.2,0]); ylabel('幅度(v)','fontsize',8);
title('高斯白噪声信号','fontsize',8);

subplot(323); plot(t,sq);   axis([0 0.1 -1.1 1.1]);
xlabel('时间(s)','fontsize',8,'position',[0.08,-1.3,0]); ylabel('幅度(v)','fontsize',8);
title('方波信号','fontsize',8);

subplot(324); plot(t,tr);   axis([0 0.1 -1.1 1.1]);
xlabel('时间(s)','fontsize',8,'position',[0.08,-1.3,0]); ylabel('幅度(v)','fontsize',8);
title('三角波信号','fontsize',8);

subplot(325); plot(t,si);   axis([0 0.1 -1.1 1.1]);
xlabel('时间(s)','fontsize',8,'position',[0.08,-1.3,0]); ylabel('幅度(v)','fontsize',8);
title('正弦波信号','fontsize',8);

subplot(326); plot(t,sin_noise); axis([0 0.1 -1.1 1.1]);
xlabel('时间(s)','fontsize',8,'position',[0.08,-1.3,0]); ylabel('幅度(v)','fontsize',8);
title('SNR=10dB的正弦波信号','fontsize',8);
2、MATLAB 常用信号分析处理函数演示示例
%E2_2_SignalProcess.m文件源代码
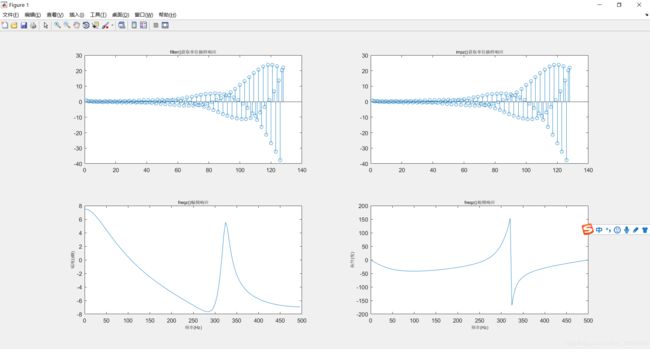
%Matlab常用信号分析处理函数演示实例:编写一个M文件,分别用filter及impz函数获取指定离散系统
%(b=[0.8 0.5 0.6],a=[1 0.2 0.4 -0.8])的单位抽样响应;用freqz函数获取系统的频率响应;分
%别用root及zplane函数获取系统的零极点图及增益。

L=128;             %单位抽样序列的长度
Fs=1000;           %采样频率为1KHz
b=[0.8 0.5 0.6];        %系统函数的分子系数向量
a=[1 0.2 0.4 -0.8];     %系统函数的分母系数向量
delta=[1 zeros(1,L-1)]; %生成长度为L的单位抽样序列

FilterOut=filter(b,a,delta); %filter函数获取单位抽样响应
ImpzOut=impz(b,a,L);         %impz函数获取单位抽样响应
[h,f]=freqz(b,a,L,Fs);       %freqz函数求频率响应
mag=20*log(abs(h))/log(10);  %幅度转换成dB单位
ph=angle(h)*180/pi;          %相位值单位转换
zr=roots(b)  %求系统的零点,并显示在命令窗口
pk=roots(a)  %求系统的极点,并显示在命令窗口
g=b(1)/a(1)  %求系统的增益,并显示在命令窗口

%绘图
figure(1);
subplot(221);stem(FilterOut);
title('filter()获取单位抽样响应','fontsize',8);
subplot(222);stem(ImpzOut);
title('impz()获取单位抽样响应','fontsize',8);
subplot(223);plot(f,mag);
xlabel('频率(Hz)','fontsize',8);
ylabel('幅度(dB)','fontsize',8);
title('freqz()幅频响应','fontsize',8);
subplot(224);plot(f,ph);
xlabel('频率(Hz)','fontsize',8);
ylabel('相位(度)','fontsize',8);
title('freqz()相频响应','fontsize',8);
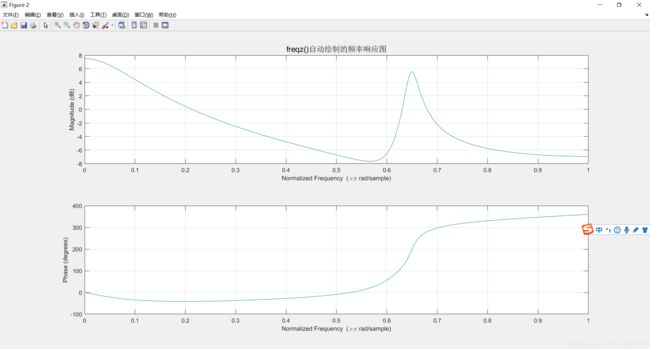
figure(2);
freqz(b,a); %用feqz函数绘制系统频率响应
title('freqz()自动绘制的频率响应图','fontsize',14);
figure(3);
zplane(b,a);%用zplane函数绘制系统零极点图
title('zplane()自动绘制的系统零极点图','fontsize',14);
3、快速傅里叶函数演示示例
%E2_3_fft.m文件源代码
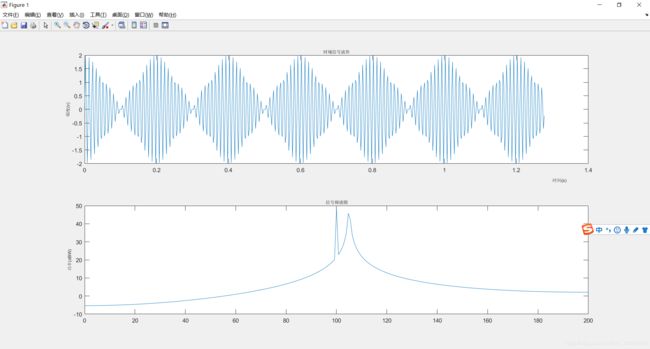
%快速傅立叶函数演示实例:编写一个M文件,产生频率为100Hz和105Hz正弦信号叠加后的信号,用fft函数
%对信号进行频率分析,要求在频率上能分辨出两种频率的正弦信号,分别绘出信号的时域及频域波形。

N=512;   %数据长度
f1=100;  %信号频率,单位为Hz
f2=105;
Fs=400;  %采样频率,单位为Hz
t=0:1/Fs:1/Fs*(N-1);             %产生时间序列
s=sin(2*pi*f1*t)+sin(2*pi*f2*t); %产生两个频率信号的叠加信号
f=fft(s,N);                      %计算傅立叶变换
f=20*log(abs(f))/log(10);        %换算成dBW单位
ft=[0:(Fs/N):Fs/2];              %转换横坐标以Hz为单位
f=f(1:length(ft));
%绘图
subplot(211);plot(t,s);
xlabel('时间(s)','fontsize',8,'position',[1.32,-2.5,0]); ylabel('幅度(v)','fontsize',8);
title('时域信号波形','fontsize',8);
subplot(212);plot(ft,f);
xlabel('频率(Hz)','fontsize',8,'position',[180,-34.38,0]); ylabel('功率(dBW)','fontsize',8);
title('信号频谱图','fontsize',8);
4、混频器设计分析实例
在FPGA中实现一个简单的混频器电路,模拟仿真两个625 kHz正弦波信号相乘输出,其中625 kHz的本振信号由FPGA内部的数字控制振荡器(Numerically Controlled Oscillator, NCO)产生,625 kHz输入正弦波信号通过读取外部TXT文件(SinIn.txt)产生。文件 SinIn.txt由MATLAB仿真程序(E2_4_SimSigPrduce.m)产生,电路还需将混频后的信号滤除直流分量,并将滤除直流分量的1.25 MHz的正弦信号输出。
为便于在 FPGA 电路板上直观显示结果,将输入的625 kHz信号及输出的1.25 MHz信号均进仃625 000分频处理,开整形输出(过零检测),驱动电路板上的LED灯显示。设置信号采样频率为5 MHz,FPGA的系统时钟为5 MHz,输入数据为10 bit,混频输出数据为20 bit。FPGA目标芯片为Altera 的Cyclone IV系列芯片EP4CE15F17C8。
1、 MATLAB软件仿真
%E2_4_SimSigProduce.m程序清单
%设置系统参数
fi=625000;					%输入信号的频率
fc=625000;					%本振信号的频率
Fs=5000000;					%采样频率
L=1024;						%数据长度
N=10;						%量化位数

%产生输入信号
t=0:1/Fs:(1/Fs)*(L-1);		%产生采样频率的时间序列
theta=rand()*2*pi;			%产生一个随机相位角度
si=sin(2*pi*fi*t+theta);	%生成具有随机起始相位的正弦波输入信号
si=round(si*(2^(N-1)-1));	%10bit量化

%产生本振信号
sc=sin(2*pi*fc*t);			%生成本振信号
sc=round(sc*(2^(N-1)-1));	%10bit量化


%仿真混频输出并画图
so=si.*sc;						%混频器输出
sof=so-mean(so);				%混频器滤除直流分量后输出
fso=abs(fft(so,L));				%求FFT变换的幅度值
%归一化处理
sc=sc/max(abs(sc));
si=si/max(abs(si));
so=so/max(abs(so));
sof=sof/max(abs(sof));
fso=fso/max(fso);
%转换成相对于原点对称的信号
fso=[fso(L/2+1:L),fso(1:L/2)];
%画图
m=[-L/2:1:(L/2-1)]*Fs/L*(10^(-6));	%生成频率坐标轴,单位为MHz
t=t*(10^6);						    %生成时间坐标轴,单位为?s
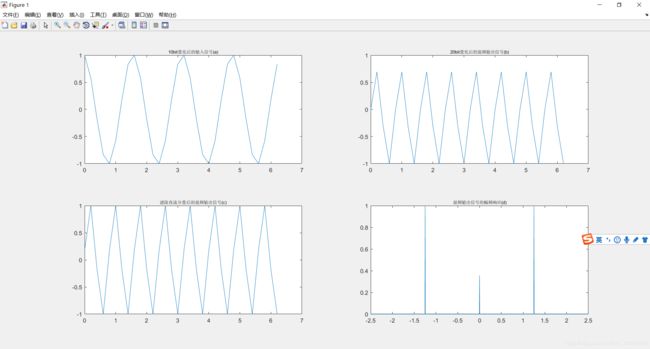
subplot(221);plot(t(1:32),si(1:32));
title('10bit量化后的输入信号(a)','fontsize',8);
subplot(222);plot(t(1:32),so(1:32));
title('20bit量化后的混频输出信号(b)','fontsize',8);
subplot(223);plot(t(1:32),sof(1:32));
title('滤除直流分量后的混频输出信号(c)','fontsize',8);
subplot(224);plot(m,fso);
title('混频输出信号的幅频响应(d)','fontsize',8);

%将生成的输入正弦信号数据,写入外部文本文件(SinIn.txt)中
f_s=si/max(abs(si));%归一化处理
Q_s=round(f_s*(2^(N-1)-1));
%%%%%%%%%%%%%%%%%%%%%%%%%%%%%%%%%%%%%
%新建文本文件前,必须建好文件存放的目录文件夹,否则出现提示信息:
%??? Error using ==> fprintf
%Invalid file identifier
fid=fopen('D:\Data\Matlab\My Programs\FPGA\SinIn.txt','w');
for k=1:length(Q_s)
    B_s=dec2bin(Q_s(k)+(Q_s(k)<0)*2^N,N);
    %k;
    for j=1:N
       if B_s(j)=='1'
           tb=1;
       else
           tb=0;
       end
       fprintf(fid,'%d',tb);
    end
    fprintf(fid,'\r\n');
end
fprintf(fid,';');
fclose(fid);
2、 FPGA 设计与实现
1) FPGA 设计输入
创建NCO核:输出幅度位宽(Magnitude Precision)为10比特;时钟速率(Clock Rate)为50 MHz,输出信号频率(Desired Output Frequency)为625KHz;
编写顶层文件代码:Mixer.v
module Mixer (
	rst,clk,din,
	s_oc,dout,ldoc,ldmix);

	input		rst;         //复位信号,高电平有效
	input		clk;         //数据采样时钟/FPGA系统时钟,频率为5MHz
	input	   [9:0]	 din;  //输入的625KHz单频信号
	output 	[9:0]	 s_oc; //本地OC输出的625KHz单频信号
	output	[19:0] dout; //输出混频滤波后的的1.25MHz单频信号
	output	ldoc;        //对本地oc分频后的显示信号
	output	ldmix;       //对混频输出信号分频后的显示信号

	//实例化NCO IP核oc
   wire reset_n,out_valid,clken;
	wire [15:0] phi_inc_i;
	wire [9:0]  oc_sin;
	assign reset_n = !rst;       //oc的复位信号低电平有效
	assign phi_inc_i = 16'd8192; //设置频率为625KHz
	assign clken = 1'b1;         //设置时钟允许信号始终有效
	assign s_oc = oc_sin;        //将oc的输出信号送至模块输出
	oc U1(
		.phi_inc_i(phi_inc_i),
		.clk(clk),
		.reset_n(reset_n),
		.clken(clken),
		.fsin_o(oc_sin),
		.out_valid(out_valid));

   //乘法运算实现混频输出
	reg signed [19:0] mult;
	wire signed [9:0] s_din;
	wire signed [9:0] s_oc_sin;
	assign s_din = din;       //将乘数转换成有符号数运算
	assign s_oc_sin = oc_sin; //将乘数转换成有符号数运算
	always @(posedge clk or posedge rst)
		if (rst)
			mult <= 20'd0;
		else
			mult <= s_din * s_oc_sin;

	//求均值:类似于求直流分量
	reg signed [19:0] m1,m2,m3,m4,m5,m6,m7;
	always @(posedge clk or posedge rst)
		if (rst)
			begin
				m1 <= 20'd0;
				m2 <= 20'd0;
				m3 <= 20'd0;
				m4 <= 20'd0;
				m5 <= 20'd0;
				m6 <= 20'd0;
				m7 <= 20'd0;
			end
		else
			begin
				m1 <= mult;
				m2 <= m1;
				m3 <= m2;
				m4 <= m3;
				m5 <= m4;
				m6 <= m5;
				m7 <= m6;
			end
	wire signed [22:0] madd;
	wire signed [19:0] mean,mt;
	assign madd = mult+m1+m2+m3+m4+m5+m6+m7;
	assign mean = madd[22:3];//舍弃2-0位,相当于除了8;

	//滤出直流分量(均值)
	assign mt = mult -mean;
	assign dout = mt;

	//625K分频输出,驱动LED灯显示ldoc
	integer  i_oc;
	reg doc;
	always @(posedge oc_sin[9] or posedge rst)
		if (rst)
			begin
				i_oc <= 0;
				doc <= 1'b0;
			end
		else
			begin
			   if (i_oc == 312500)
				   begin
						doc <= !doc;
						i_oc <= 0;
					end
				else
				   i_oc <= i_oc +1;
			end
	assign ldoc = doc;

	//625K分频输出,驱动LED灯显示ldmix
	integer  i_dmix;
	reg dmix;
	always @(posedge mt[19] or posedge rst)
		if (rst)
			begin
				i_dmix <= 0;
				dmix <= 1'b0;
			end
		else
			if (i_dmix == 312500)
				begin
					dmix <= !dmix;
					i_dmix <= 0;
				end
			else
				i_dmix <= i_dmix +1;
	assign ldmix = dmix;

endmodule
③编写用户约束文件,用于引脚分配
#------------------GLOBAL--------------------#
set_global_assignment -name RESERVE_ALL_UNUSED_PINS "AS INPUT TRI-STATED"
set_global_assignment -name ENABLE_INIT_DONE_OUTPUT OFF

#复位引脚
set_location_assignment	PIN_M1	-to rst

#时钟引脚
set_location_assignment	PIN_R9	-to clk

#LED对应的引脚
set_location_assignment	PIN_J1	-to ldoc
set_location_assignment	PIN_J2	-to ldmix


#输入信号对应的引脚
set_location_assignment	PIN_R8	-to din[0]
set_location_assignment	PIN_E1	-to din[1]
set_location_assignment	PIN_T8   -to din[2]
set_location_assignment	PIN_M2	-to din[3]
set_location_assignment	PIN_T9	-to din[4]
set_location_assignment	PIN_A8	-to din[5]
set_location_assignment	PIN_G5	-to din[6]
set_location_assignment	PIN_G11	-to din[7]
set_location_assignment	PIN_C14	-to din[8]
set_location_assignment	PIN_E7	-to din[9]
④ 时钟信号进行时序约束
2) 综合实现及仿真
完成综合实现后,工作过程区显示整个设计所占用的器件资源情况:
① 编写设计测试激励文件
在激励文件中将部分仿真结果数据写入外部的文本文件中,以方便使用MATLAB软件读取数据,并进一步分析仿真结果。
生成模块测试文件(Mixer.vt)
// Copyright (C) 1991-2012 Altera Corporation
// Your use of Altera Corporation's design tools, logic functions
// and other software and tools, and its AMPP partner logic
// functions, and any output files from any of the foregoing
// (including device programming or simulation files), and any
// associated documentation or information are expressly subject
// to the terms and conditions of the Altera Program License
// Subscription Agreement, Altera MegaCore Function License
// Agreement, or other applicable license agreement, including,
// without limitation, that your use is for the sole purpose of
// programming logic devices manufactured by Altera and sold by
// Altera or its authorized distributors.  Please refer to the
// applicable agreement for further details.

// *****************************************************************************
// This file contains a Verilog test bench template that is freely editable to
// suit user's needs .Comments are provided in each section to help the user
// fill out necessary details.
// *****************************************************************************
// Generated on "05/17/2014 12:25:12"

// Verilog Test Bench template for design : Mixer
//
// Simulation tool : ModelSim-Altera (Verilog)
//

`timescale 1 ns/ 1 ns //设置仿真时间单位:ns
module Mixer_vlg_tst();
// constants
// general purpose registers
//reg eachvec;
// test vector input registers
reg clk;
reg [9:0] din;
reg rst;
// wires
wire [19:0]  dout;
wire ldmix;
wire ldoc;
wire [9:0]  s_oc;

// assign statements (if any)
Mixer i1 (
// port map - connection between master ports and signals/registers
	.clk(clk),
	.din(din),
	.dout(dout),
	.ldmix(ldmix),
	.ldoc(ldoc),
	.rst(rst),
	.s_oc(s_oc)
);


parameter clk_period=200; //设置时钟信号周期(频率):5MHz
parameter clk_half_period=clk_period/2;
parameter data_num=800;  //仿真数据长度
parameter time_sim=data_num*clk_period; //仿真时间
initial
begin
	//设置时钟信号初值
	clk=1;
	//设置复位信号
	rst=1;
	#50 rst=0;
	//设置仿真时间
	#time_sim $finish;
	//设置输入信号初值
	din=10'd10;
end

//产生时钟信号
always
	#clk_half_period clk=~clk;

//从外部TX文件(SinIn.txt)读入数据作为测试激励
integer Pattern;
reg [9:0] stimulus[1:data_num];
initial
begin
   //文件必须放置在"工程目录\simulation\modelsim"路径下
	$readmemb("SinIn.txt",stimulus);
	Pattern=0;
	repeat(data_num)
		begin
			Pattern=Pattern+1;
			din=stimulus[Pattern];
			#clk_period;
		end
end


//将仿真数据dout写入外部TXT文件中(out.txt)
integer file_out;
initial
begin
   //文件放置在"工程目录\simulation\modelsim"路径下
	file_out = $fopen("out.txt");
	if(!file_out)
		begin
			$display("could not open file!");
			$finish;
		end
end
wire rst_write;
wire signed [19:0] dout_s;
assign dout_s = dout;           //将dout转换成有符号数据
assign rst_write = clk & (!rst);//产生写入时钟信号,复位状态时不写入数据
always @(posedge rst_write )
	$fdisplay(file_out,"%d",dout_s);


//将仿真数据s_oc写入外部TXT文件中(oc.txt)
integer file_oc;
initial
begin
   //文件放置在"工程目录\simulation\modelsim"路径下
	file_oc = $fopen("oc.txt");
	if(!file_oc)
		begin
			$display("could not open file!");
			$finish;
		end
end
wire signed [9:0] oc_s;
assign oc_s = s_oc;//将oc_s转换成有符号数据
always @(posedge rst_write)
	$fdisplay(file_oc,"%d",oc_s);

endmodule
行为仿真用于检查程序的语法功能,时序仿真可真实地反映程序运行情况;两种仿真过程中的使用及操作方法本身没有区别,下面以行为仿真为例讲解仿真过程及ModelSim的使用方法。
用ModelSim 进行仿真时,由于测试激励文件中编写了将仿真测试数据dout、s_oc 写入外部文本文件的代码,程序将自动在指定的文本文件中按设计要求写入仿真结果数据。从ModelSim 的波形界面中虽然能查看信号仿真波形,但要想对数据进行进一步详细分析,如查看信号的频谱等,就显得无能为力了。这一部分工作正好用MATLAB 软件来完成。
3、MATLAB 对仿真数据进行分析
%E2_4_FpgaSim.m
%设置系统参数
% fi=625000;  %输入信号的频率
% fc=625000;  %本振信号的频率
Fs=5000000; %采样频率
L=256;  %数据长度
%从文本文件中读取数据
fid=fopen('D:\Data\FPGA\Mixer\simulation\modelsim\out.txt');
[FpgaOut,count]=fscanf(fid,'%d',inf);
fclose(fid);
fid=fopen('D:\Data\FPGA\Mixer\simulation\modelsim\oc.txt');
[FpgaOc,count]=fscanf(fid,'%d',inf);
fclose(fid);
%count
%取出一段数据进行计算
FpgaOut=FpgaOut(1:L)';%读出的数据为列向量,转换成行向量
FpgaOc=FpgaOc(1:L)';
Fout=abs(fft(FpgaOut,L));  %求FFT变换的幅度值
%归一化处理
FpgaOut=FpgaOut/max(abs(FpgaOut));
FpgaOc=FpgaOc/max(abs(FpgaOc));
Fout=Fout/max(Fout);
Fout=[Fout(L/2+1:L),Fout(1:L/2)]; %转换成相对于原点对称的信号
%生成时间及频率坐标轴
t=[0:L-1];                        %生成时间坐标轴,单位为us
t=t*(1/Fs)*(10^6);
m=[-L/2:1:(L/2-1)]*Fs/L*(10^(-6));%生成频率坐标轴,单位为MHz
%画图
subplot(311);plot(t(1:32),FpgaOc(21:52));
xlabel('时间(us)','fontsize',8,'position',[6.5,-1.2,0]); ylabel('幅度','fontsize',8);
title('DDS产生的本振信号(a)','fontsize',8);

subplot(312);plot(t(1:32),FpgaOut(21:52));
xlabel('时间(us)','fontsize',8,'position',[6.5,-1.2,0]); ylabel('幅度','fontsize',8);
title('FPGA混频输出信号(b)','fontsize',8);

subplot(313);plot(m,Fout);
xlabel('频率(MHz)','fontsize',8,'position',[2.3,-0.3,0]); ylabel('幅度','fontsize',8);
title('FPGA混频输出信号的幅频响应(c)','fontsize',8);


