Seurat | 强烈建议收藏的单细胞分析标准流程(差异分析与细胞注释)(五)
1写在前面
本期我们介绍一下如何使用Seurat包进行差异分析,以及如何使用SingleR进行细胞注释。
2用到的包
rm(list = ls())
library(Seurat)
library(tidyverse)
library(SingleR)
library(celldex)
library(RColorBrewer)
library(SingleCellExperiment)
3示例数据
这里我们还是使用之前建好的srat文件,我之前保存成了.Rdata,这里就直接加载了。
load("./srat2.Rdata")
srat

4差异分析
首先要和大家说的是,尽量使用counts进行差异分析,而不是你SCTransform等操作后的数据。
我们先将assy还原回原始矩阵吧,进行一下过滤。
4.1 初步处理
DefaultAssay(srat) <- "RNA"
srat <- NormalizeData(srat)
srat <- FindVariableFeatures(srat, selection.method = "vst", nfeatures = 2000)
all.genes <- rownames(srat)
srat <- ScaleData(srat, features = all.genes)

4.2 计算所有marker
all.markers <- FindAllMarkers(srat, only.pos = T, min.pct = 0.5, logfc.threshold = 0.5)

4.3 Top3
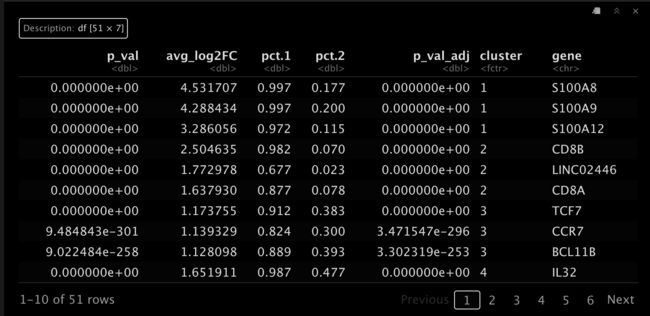
接着我们看看各个Cluster的top3基因是什么。
top3_markers <- as.data.frame(all.markers %>% group_by(cluster) %>%
                                top_n(n = 3, wt = avg_log2FC))
top3_markers

5细胞注释
5.1 手动注释
通过上面找到的基因,结合我们通过文献、数据库等可以成功注释细胞的类型。 有的小伙伴就会说了:那不就是手动注释了吗!?
是的,其实目前最准确的注释方法就是手动注释,提供一个我个人常用的数据库(CellMarker):
http://xteam.xbio.top/CellMarker/
5.2 自动注释
这里我们先将Seurat转成SingleCellExperiment,方便后续操作。
sce <- as.SingleCellExperiment(DietSeurat(srat))
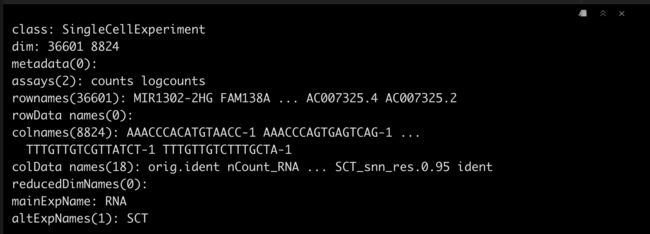
sce

5.3 背景文件
背景文件我们使用celldex包的数据,大家根据自己的需要选择就行了。
Note! 这个文件里会有两种类型,label.main和label.fine,我们后面都使用一下吧。
monaco.ref <- celldex::MonacoImmuneData()
# hpca.ref <- celldex::HumanPrimaryCellAtlasData()
# dice.ref <- celldex::DatabaseImmuneCellExpressionData()
5.4 SingleR
常用的自动注释包,包括signleR, Cellassign等。
这里我们用SingleR试一下吧。
monaco.main <- SingleR(test = sce,assay.type.test = 1,ref = monaco.ref,labels = monaco.ref$label.main)
monaco.fine <- SingleR(test = sce,assay.type.test = 1,ref = monaco.ref,labels = monaco.ref$label.fine)
# hpca.main <- SingleR(test = sce,assay.type.test = 1,ref = hpca.ref,labels = hpca.ref$label.main)
# hpca.fine <- SingleR(test = sce,assay.type.test = 1,ref = hpca.ref,labels = hpca.ref$label.fine)
# dice.main <- SingleR(test = sce,assay.type.test = 1,ref = dice.ref,labels = dice.ref$label.main)
# dice.fine <- SingleR(test = sce,assay.type.test = 1,ref = dice.ref,labels = dice.ref$label.fine)
5.5 查看结果
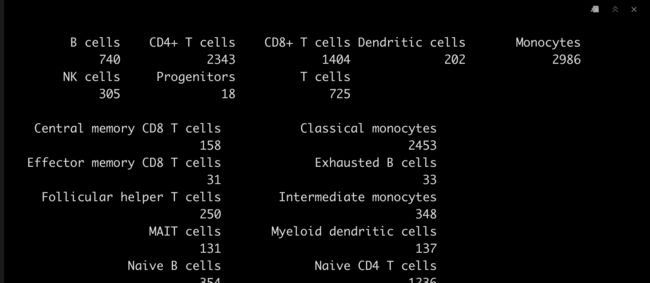
table(monaco.main$pruned.labels)
table(monaco.fine$pruned.labels)

#table(hpca.main$pruned.labels)
# table(hpca.fine$pruned.labels)
#table(dice.main$pruned.labels)
# table(dice.fine$pruned.labels)

5.6 添加信息
[email protected]$monaco.main <- monaco.main$pruned.labels
[email protected]$monaco.fine <- monaco.fine$pruned.labels

# [email protected]$hpca.main   <- hpca.main$pruned.labels
# [email protected]$dice.main   <- dice.main$pruned.labels
# [email protected]$hpca.fine   <- hpca.fine$pruned.labels
# [email protected]$dice.fine   <- dice.fine$pruned.labels
5.7 可视化
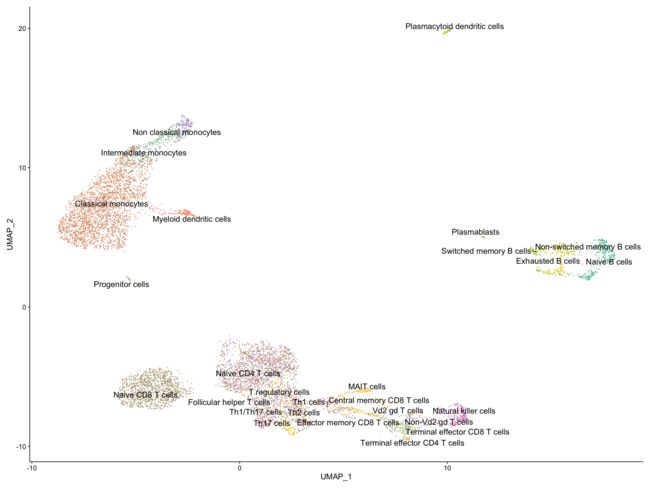
srat <- SetIdent(srat, value = "monaco.fine")

ncluster <- length(unique(srat[[]]$monaco.fine))

mycol <- colorRampPalette(brewer.pal(8, "Set2"))(ncluster)

DimPlot(srat,
        label = T , repel = T,
        label.size = 5,
        cols = mycol) +
  NoLegend()

6简单验证
我们简单验证一下注释效果,用几个已知marker看一下吧,已知:
plasma B,CD38和CD59;MAIT cells,CD161 (KLRB1)和CXCR6。
6.1 plasma B
FeaturePlot(srat,c("CD38","CD59"),
            label = T, repel = T)
6.2 MAIT cells
FeaturePlot(srat,c("KLRB1", "CXCR6"),
            label = T, repel = T)

需要示例数据的小伙伴,在公众号回复
Seurat获取吧!点个在看吧各位~ ✐.ɴɪᴄᴇ ᴅᴀʏ 〰
本文由 mdnice 多平台发布