matplotlib中【colormap】和【colorbar】的使用,以及用自己的颜色创建colormap
目录
- 官方自带的colormap
-
- 其他的colormap
- 结果
- 用自己的颜色创建colormap
- 获取图片颜色
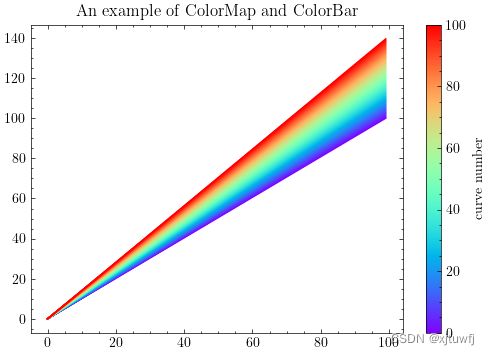
官方自带的colormap
import numpy as np
import matplotlib.pyplot as plt

num_curves = 100 #100条曲线
cm = plt.cm.rainbow(np.linspace(0, 1, num_curves))
sm = plt.cm.ScalarMappable(cmap='rainbow',
                               norm=plt.Normalize(vmin=0, vmax=num_curves))
fig = plt.figure(figsize=(6,4))
for i in range(num_curves):
    curve = np.linspace(0,100+0.4*i,100) #生成曲线
    plt.plot(curve,color=cm[i])
plt.title('An example of ColorMap and ColorBar')
cb = plt.colorbar(sm)
cb.set_label('curve number')
plt.show()
其他的colormap
可参考官网链接: https://matplotlib.org/2.0.2/users/colormaps.html
结果
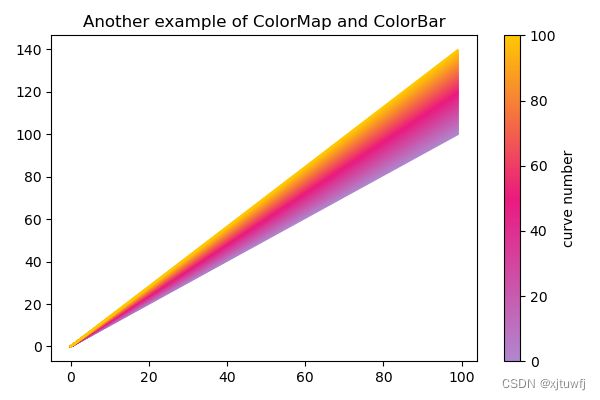
用自己的颜色创建colormap
from matplotlib.colors import LinearSegmentedColormap
def create_colormap(rgb_list,alpha_list=None):
    '''
    取rgb_list里面的颜色,通过等间隔线性插值,生成colormap
    :param rgb_list: 形如[(0.69,0.53,0.81),(0.92,0.10,0.50),(1.00,0.78,0.01)]
                    list中的颜色为colorbar中插值点的颜色
    :param alpha_list: 透明度列表,形如[0.2,0.3]
    :return:colorbar
    '''
    num_of_colors = len(rgb_list)
    interpolation_points = np.linspace(0,1,num_of_colors) #插值点位置
    red, green, blue = [], [], []
    for i in range(num_of_colors):
        r = [interpolation_points[i],rgb_list[i][0],rgb_list[i][0]]
        g = [interpolation_points[i],rgb_list[i][1],rgb_list[i][1]]
        b = [interpolation_points[i],rgb_list[i][2],rgb_list[i][2]]
        red.append(r)
        green.append(g)
        blue.append(b)
    if alpha_list is not None: #透明度变化
        alpha = []
        local = np.linspace(0, 1, len(alpha_list))
        for i in range(len(alpha_list)):
            alpha.append([local[i],alpha_list[i],alpha_list[i]])
    else: #不透明
        alpha =[[0,1,1],[1,1,1]]
    color_dict = {
        'red':red,
        'green':green,
        'blue':blue,
        'alpha':alpha
    }
    my_colormap = LinearSegmentedColormap(name='my_colormap', segmentdata=color_dict)
    plt.register_cmap(cmap=my_colormap)
    return my_colormap
测试create_colormap函数
color_list = [(0.69,0.53,0.81),(0.92,0.10,0.50),(1.00,0.78,0.01)]
cmap = create_colormap(color_list)
num_curves = 100 #100条曲线
cm = cmap(np.linspace(0, 1, num_curves))
sm = plt.cm.ScalarMappable(cmap=cmap,norm=plt.Normalize(vmin=0, vmax=num_curves))
fig = plt.figure(figsize=(6,4))
for i in range(num_curves):
    curve = np.linspace(0,100+0.4*i,100) #生成曲线
    plt.plot(curve,color=cm[i])
plt.title('Another example of ColorMap and ColorBar')
cb = plt.colorbar(sm)
cb.set_label('curve number')
plt.show()
获取图片颜色
可以参考这篇:https://blog.csdn.net/baidu_38963740/article/details/125210583?spm=1001.2014.3001.5501