02_01 python机器学习_第二章监督学习_监督学习概念&数据样本
第二章监督学习_监督学习概念&数据样本
01 概念部分
01_001 监督学习分类
监督学习分为两类:
- 分类 classsification
一般解决判断某种类型 有点像选择题, 选项给好了,找出选项就行 - 回归 regression
一般解决预测问题, 通过一段连续的数据预测接下数据的某种可能性, 比如天气预报.
是用一堆的特征数据综合来判断一个数据的结果
01_002 常用名词解释 泛化 过拟合 欠拟合
泛化我理解就是一滴墨水滴到纸上后,能扩大到整个纸的多少.
纸就想到于数据,墨水好比算法.
算法不能太具体也不能太概括.
- 太具体叫过拟合 overfitting, 就好比使用了一个0.00001nm的笔尖滴了一滴墨,虽然很精准,但是无法以此类推其他数据,这种算法只能识别特定类型的数据.
- 太概括叫欠拟合 underfitting, 就好比钢笔漏水,一大滴墨滴纸上,覆盖的面积倒是不少,模型对数据的选择没有重点,面对新数据还是一塌糊度.
训练精度就好比滴墨的位置. 四角肯定覆盖数据会少一些.
一个最佳模型要能是机器不仅能够准确判断训练数据,还能够为新数据做出相对准确的判单,而不是在已有的数据集中搜索选择.
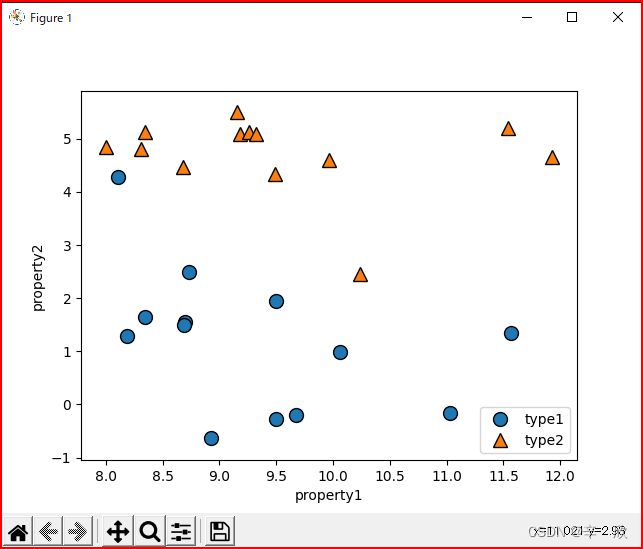
01_003 监督学习关于分类的一个小例子
# 颜色配色方案
import mglearn
# 绘图库
import matplotlib.pyplot as plt

# x
#   包含横纵坐标的二维数组.
#   1维是单个数据个体,
#   2维是数据拥有的两个特征的数据, 矩阵图中正好用于表示横纵坐标
x, y = mglearn.datasets.make_forge()
# print(x[:3])
# print(y[:3])

# 这个类最终会将内容设置到matplotlib.pyplot中,分析的方法跟之前讲过的一样
# 有兴趣的可以自己研究:
# 位置: .venv\Lib\site-packages\mglearn\plot_helpers.py
mglearn.discrete_scatter(x[:, 0], x[:, 1], y)
# 这库不识别中文......
# plt.legend(["种类1", "种类2"], loc=4)
# plt.xlabel("第一特征")
# plt.ylabel("第二特征")

# loc
#   location 位置参数 4:lower right
plt.legend(["type1", "type2"], loc=4)
# 横坐标轴名称
plt.xlabel("property1")
# 纵坐标轴名称
plt.ylabel("property2")

plt.show()
上面例子中某一时点临时打出来的变量信息参照:
In [2]: x[:4]
Out[2]:
array([[ 9.96346605,  4.59676542],
       [11.0329545 , -0.16816717],
       [11.54155807,  5.21116083],
       [ 8.69289001,  1.54322016]])

In [3]: y[:4]
Out[3]: array([1, 0, 1, 0])
函数帮助:
In [4]: help(mglearn.discrete_scatter)
Help on function discrete_scatter in module mglearn.plot_helpers:

discrete_scatter(x1, x2, y=None, markers=None, s=10, ax=None, labels=None, padding=0.2, alpha=1, c=None, markeredgewidth=None)
    Adaption of matplotlib.pyplot.scatter to plot classes or clusters.

    Parameters
    ----------

    x1 : nd-array
        input data, first axis

    x2 : nd-array
        input data, second axis

    y : nd-array
        input data, discrete labels

    cmap : colormap
        Colormap to use.

    markers : list of string
        List of markers to use, or None (which defaults to 'o').

    s : int or float
        Size of the marker

    padding : float
        Fraction of the dataset range to use for padding the axes.

    alpha : float
        Alpha value for all points.

In [5]: help(plt.legend)
Help on function legend in module matplotlib.pyplot:

legend(*args, **kwargs)
    Place a legend on the Axes.
    ......
        loc : str or pair of floats, default: :rc:`legend.loc` ('best' for axes, 'upper right' for figures)
        The location of the legend.
            ===============   =============
            Location String   Location Code
            ===============   =============
            'best'            0
            'upper right'     1
            'upper left'      2
            'lower left'      3
            'lower right'     4
            'right'           5
            'center left'     6
            'center right'    7
            'lower center'    8
            'upper center'    9
            'center'          10
            ===============   =============
     ......
显示效果
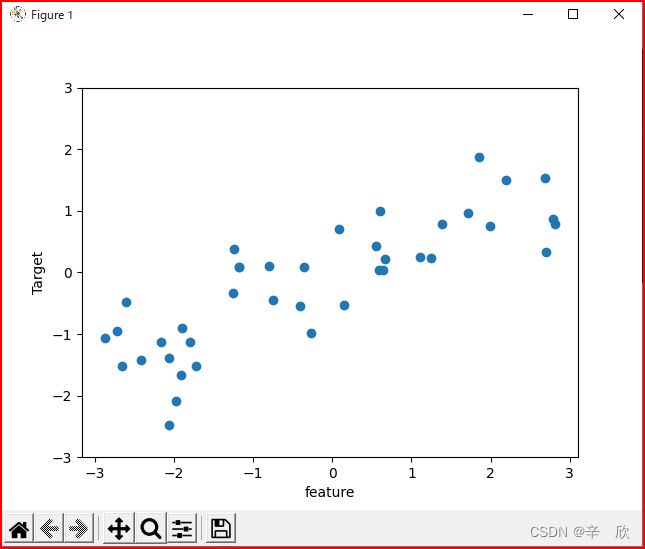
01_004 监督学习关于回归的一个小例子
回归应用领域是预测,区别于分类的结果,应答表现的是一种趋势.
import mglearn
import matplotlib.pyplot as plt

x, y = mglearn.datasets.make_wave(n_samples=40)
plt.plot(x, y, 'o')
plt.ylim(-3, 3)
plt.xlabel("feature")
plt.ylabel("Target")

plt.show()
例子中特征只有一种,其实可以更复杂,这里只是为了便于描述
In [7]: x[:10]
Out[7]:
array([[-0.75275929],
       [ 2.70428584],
       [ 1.39196365],
       [ 0.59195091],
       [-2.06388816],
       [-2.06403288],
       [-2.65149833],
       [ 2.19705687],
       [ 0.60669007],
       [ 1.24843547]])

In [8]: y[:10]
Out[8]:
array([-0.44822073,  0.33122576,  0.77932073,  0.03497884, -1.38773632,
       -2.47196233, -1.52730805,  1.49417157,  1.00032374,  0.22956153])
01_005 关于小例子中使用包的疑问
-
问题:第一章我记的使用机器学习的数据源是来自于sklearn.datasets而这里为什么是mglearn.datasets难道机器学习中每个包下都有datasets?
查看了一下 numpy matplotlib pandas scipy sklearn mglearn, 发现只有机器学习包sklearn mglearn下有datasets类,基础类下是没有的.
第一章使用sklearn是为了说明k邻近算法,而这里只是为了说明一下成像效果,单纯使用mglearn就可以了,而mglearn在创建之初也考虑到这种需求可能,所以本身包下有一部分测试数据用于快速显示. -
回归例子中使用的数据是一个特征的二维数组, 说是为了便于描述, 如果是多维的,会显示成啥样?
In [4]: import mglearn

In [5]: help(mglearn.datasets.make_wave)
Help on function make_wave in module mglearn.datasets:

make_wave(n_samples=100)
调查发现接口并没有设置数据的地方, 这也验证了它就是测试自己模块用的现成数据.
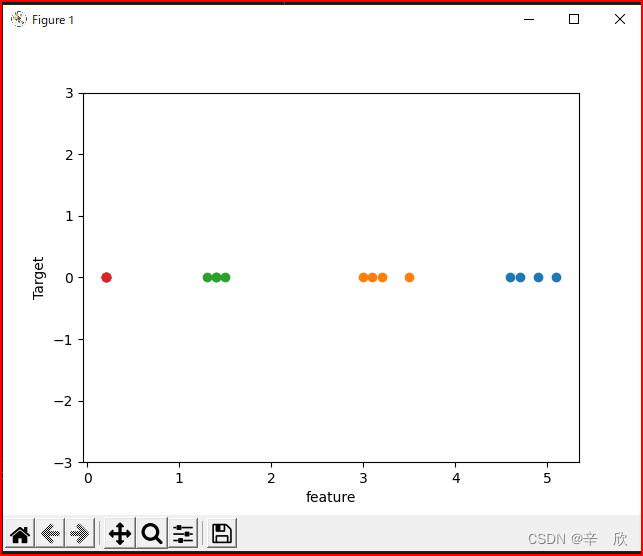
使用第一章鸢尾花数据试试# 机器学习 数据模型 from sklearn.datasets import load_iris import mglearn import matplotlib.pyplot as plt iris_dataset = load_iris() # x, y = mglearn.datasets.make_wave(n_samples=40) plt.plot(iris_dataset['data'][:4], iris_dataset['target'][:4], 'o') plt.ylim(-3, 3) plt.xlabel("feature") plt.ylabel("Target") plt.show()In [2]: iris_dataset['data'][:4] Out[2]: array([[5.1, 3.5, 1.4, 0.2], [4.9, 3. , 1.4, 0.2], [4.7, 3.2, 1.3, 0.2], [4.6, 3.1, 1.5, 0.2]]) In [3]: iris_dataset['target'][:4] Out[3]: array([0, 0, 0, 0])上面可以看出纵轴表示结果, 因为target全是0 因此都在一行上显示
横轴方向, 没个特征为一种颜色,鸢尾花有4个特征,所以4种颜色,每种颜色都在自己的取值区间显示.
看起来确实不如一个特征数据来的直接.
02 数据样本资源
- 乳腺癌数据样本 sklearn.datasets.load_breast_cancer
- 波士顿房价数据样本 sklearn.datasets.load_boston
- 糖尿病数据样本 sklearn.datasets.load_diabetes
- 手写数字数据样本 sklearn.datasets.load_digits
- 鸢尾花数据样本 sklearn.datasets.load_iris
- 体能训练数据样本 sklearn.datasets.load_linnerud
- 脸部照片数据样本 sklearn.datasets.fetch_olivetti_faces


