数据挖掘与数据分析实战(一)
一、数据开源
本数据分析项目的数据来源于第八届中国可视化与可视化分析大会。数据集地址连接:http://naq.cicidata.top:10443/chinavis/opendata
二、使用的工具
1、python3.8
2、pyCharm 2020.3.1
3、pandas库
4、numpy库
5、matplotlib库
三、前期准备
1、下载数据集数据。安装python3.8环境,配置pip环境变量。关于python安装配置 ,请查看本人文章python语言及其安装以及库函数配置
2、使用pip install numpy安装配置numpy库
3、使用pip install pandas安装pandas库
4、使用pip install matplotlib 安装matplotlib库
四、数据处理源码
import os
import pandas as pd
import numpy as np
import matplotlib.pylab as mpy
file_dir='E:/big_data_Demo/CN-Reanalysis201301/201301/'
files=os.listdir(file_dir)
def1=pd.read_csv(os.path.join(file_dir,files[0]))
for e in files[1:]:
def2=pd.read_csv(os.path.join(file_dir,e))
def1=pd.concat((def1,def2),axis=0,join='inner')
print(def1)
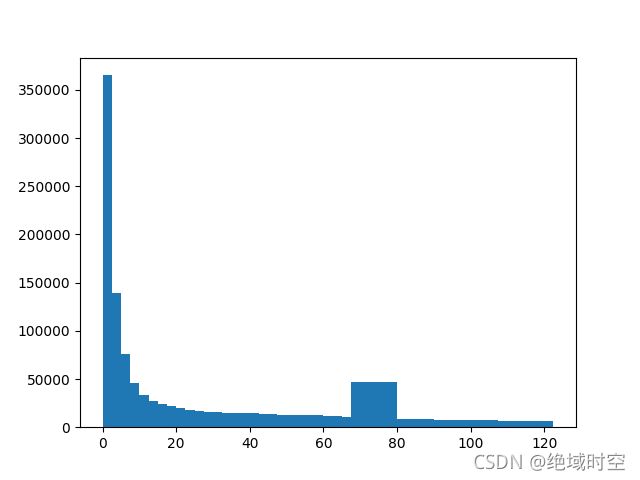
x=def1['PM2.5(微克每立方米)']
mpy.hist(x,bins=[0,2.5,5,7.5,10,12.5,15,17.5,20,22.5,25,27.5,30,32.5,35,37.5,40,42.5,45,47.5,50,52.5,55,57.5,60,62.5,65,
67.5,80,82.5,85,87.5,90,92.5,95,97.5,100,102.5,105,107.5,110,112.5,115,117.5,120,122.5])
mpy.show()
五、处理结果展示