【OpenCV-Python】教程:4-2 Harris角点检测
OpenCV Python Harris 角点检测
【目标】
- 理解Harris角点检测背后的概念;
- cv2.cornerHarris(), cv2.cornerSubPix()
【理论】
上一章节中,我们看到在图像中每个方向变化都很大的区域就是角点,一个早期的尝试是由 Chris Harris & Mike Stephens 在1998年的论文 A Combined Corner and Edge Detector 完成的。所以现在称之为 Harris 角点检测。他讲这些思想转换为数学公式形式,通过寻找不同方向上位移的亮度差异。
E ( u , v ) = ∑ x , y w ( x , y ) [ I ( x + u , y + v ) − I ( x , y ) ] 2 E(u,v)=\sum\limits_{x,y}w(x,y) [I(x+u,y+v)-I(x,y)]^2 E(u,v)=x,y∑w(x,y)[I(x+u,y+v)−I(x,y)]2
w ( x , y ) w(x,y) w(x,y) 是窗口函数,可以是矩形窗口,也可以是高斯窗口,对应像素不同的权重。
I ( x + u , y + v ) I(x+u,y+v) I(x+u,y+v) 是移动区域的亮度,
I ( x , y ) I(x,y) I(x,y) 是亮度函数;
我们需要最大化函数 E ( u , v ) E(u,v) E(u,v)进行角点检测,这就需要我们最大化 [ I ( x + u , y + v ) − I ( x , y ) ] 2 [I(x+u,y+v)-I(x,y)]^2 [I(x+u,y+v)−I(x,y)]2,将泰勒展开应用于上述方程,并使用一些数学步骤(请参考您喜欢的任何标准教科书以获得完整推导),我们得到最终方程为:
E ( u , v ) ≈ [ u v ] M [ u v ] E(u,v)\approx[u \quad v] M \begin{bmatrix} u \\ v \end{bmatrix} E(u,v)≈[uv]M[uv]
其中
M = ∑ x , y w ( x , y ) [ I x I x I x I y I y I x I y I y ] M=\sum\limits_{x,y}w(x,y)\begin{bmatrix} I_xI_x & I_xI_y \\ I_yI_x & I_yI_y \end{bmatrix} M=x,y∑w(x,y)[IxIxIyIxIxIyIyIy]
其中 I x I_x Ix 和 I y I_y Iy 是图像在 x x x 和 y y y 方向上的梯度(可以通过 sobel 获得);
然后来到了主要部分,创建了一个分数,基本就是一个等式,确定了窗口是否包含了角点与否。
R = d e t ( M ) − k ( t r a c e ( M ) ) 2 R=det(M)-k(trace(M))^2 R=det(M)−k(trace(M))2
其中:
- d e t ( M ) = λ 1 λ 2 det(M)=\lambda_1 \lambda_2 det(M)=λ1λ2
- t r a c e ( M ) = λ 1 + λ 2 trace(M)=\lambda_1+\lambda_2 trace(M)=λ1+λ2
- λ 1 \lambda_1 λ1和 λ 2 \lambda_2 λ2 是 M M M的特征值
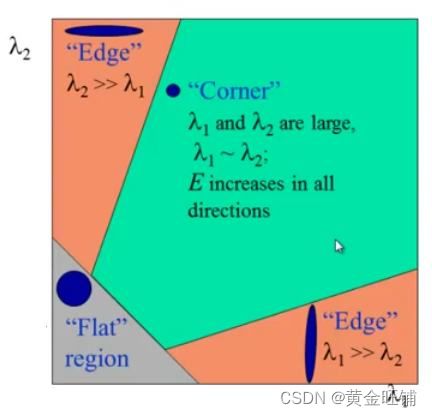
因此,这些特征值的大小决定了这个区域是角点,边还是平坦区域。
- ∣ R ∣ |R| ∣R∣ 很小,当 λ 1 \lambda_1 λ1和 λ 2 \lambda_2 λ2 很小时,区域平坦;
- R < 0 R<0 R<0,当 λ 1 ≫ λ 2 \lambda_1\gg \lambda_2 λ1≫λ2 或 λ 1 ≪ λ 2 \lambda_1 \ll \lambda_2 λ1≪λ2 时,区域是边缘;
- R R R 很大,当 λ 1 \lambda_1 λ1和 λ 2 \lambda_2 λ2很大时并且 λ 1 ≈ λ 2 \lambda_1 \approx \lambda_2 λ1≈λ2 时,区域是角点。
【代码】
import cv2
import numpy as np

# 读入图片并灰度化
# img = cv2.imread("assets/blox.jpg")
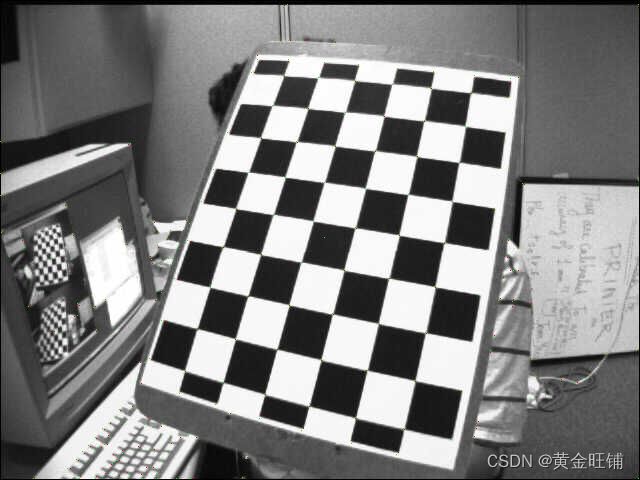
img = cv2.imread("assets/left08.jpg")
# img = cv2.imread("assets/chessboard(1).png")
gray = cv2.cvtColor(img, cv2.COLOR_BGR2GRAY)

# 检测角点
gray = np.float32(gray)
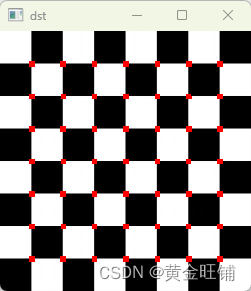
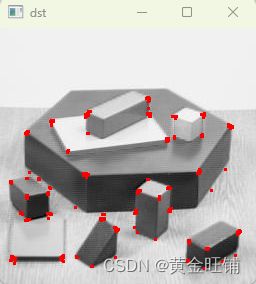
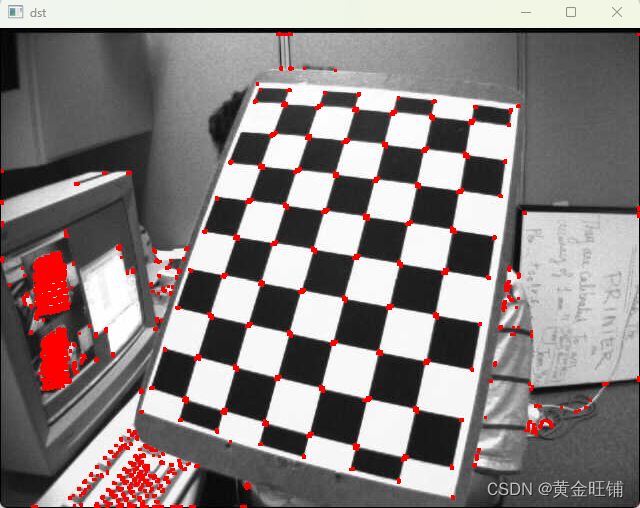
dst = cv2.cornerHarris(gray, 2, 3, 0.04)

# 膨胀
dst = cv2.dilate(dst, None)

# 找到计算值比较大的,并显示
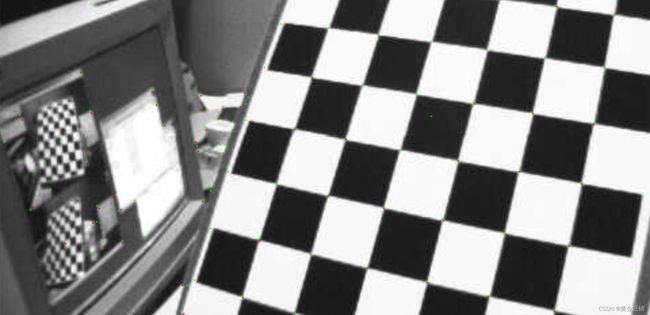
img[dst>0.01*dst.max()] = [0, 0, 255]

cv2.imshow('dst', img)
cv2.waitKey(0)
cv2.destroyAllWindows()
- 亚像素精度角点检测
import numpy as np
import cv2

# 读入图片并灰度化
img = cv2.imread("assets/left08.jpg")
gray = cv2.cvtColor(img,cv2.COLOR_BGR2GRAY)

# 寻找角点
gray = np.float32(gray)
dst = cv2.cornerHarris(gray, 2, 3, 0.04)

# 阈值化找到角点
dst = cv2.dilate(dst,None)

# 阈值化
ret, dst = cv2.threshold(dst, 0.01*dst.max(), 255, 0)
dst = np.uint8(dst)

# 找到连通域中心
ret, labels, stats, centroids = cv2.connectedComponentsWithStats(dst)

# 寻找亚像素角点
criteria = (cv2.TERM_CRITERIA_EPS + cv2.TERM_CRITERIA_MAX_ITER, 100, 0.001)
corners = cv2.cornerSubPix(gray, np.float32(centroids), (5,5), (-1,-1), criteria)

# 显示
res = np.hstack((centroids, corners))
res = np.int0(res)
img[res[:,1],res[:,0]]=[0,0,255]
img[res[:,3],res[:,2]] = [0,255,0]

cv2.imshow("res", img)
cv2.imshow("dst", dst)

cv2.waitKey(0)
cv2.destroyAllWindows()

cv2.imwrite('subpixel5.png', img)
【接口】
- cornerHarris
cv2.cornerHarris( src, blockSize, ksize, k[, dst[, borderType]] ) -> dst
Harris 角点检测
- src: 单通道8位图像或者浮点图像
- dst: 存储 harris 角点检测响应, CV_FC1 大小与源图像一致;
- blocksize: 领域大小
- ksize: sobel算子的直径
- k: harris角点检测的自由参数里的 k k k
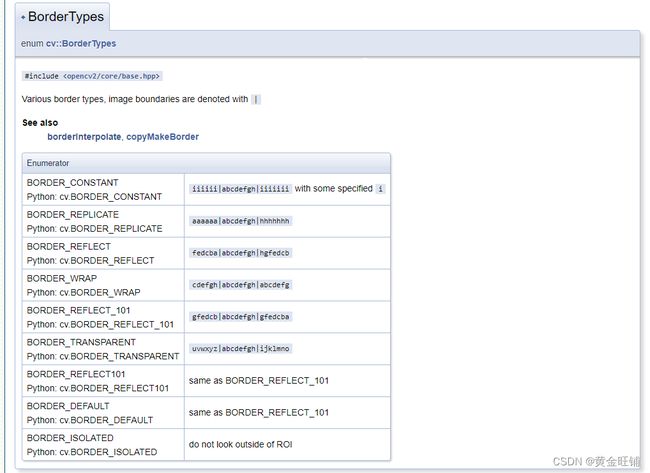
- borderType: 扩边参数,BORDER_WRAP 不支持
- borderType
- cornerSubPix
cv2.cornerSubPix( image, corners, winSize, zeroZone, criteria ) -> corners
优化角点位置
- image: 输入的单通道图像,8位或者浮点数
- corners: 初始化的角点位置,并且可以接受输出
- winSize: 搜寻窗口的半径,如果设置为 (5, 5),则搜索区域为 (52+1, 52+1) =(11,11)的窗口;
- zeroZone: (-1,-1) 表示没有这个尺寸
- criteria: 迭代准则,要么次数达到了,要么移动的距离很小了。
- connectedComponentsWithStats
cv.connectedComponentsWithStats(	image[, labels[, stats[, centroids[, connectivity[, ltype]]]]]	) ->	retval, labels, stats, centroids
cv.connectedComponentsWithStatsWithAlgorithm(	image, connectivity, ltype, ccltype[, labels[, stats[, centroids]]]	) ->	retval, labels, stats, centroids
计算二值图像连通区域,并返回一系列的统计值
- image: 8位单通道需要标记的图像
- labels: 输出的标签图像
- stats: 统计每一个标签的输出,包含背景标签
- centroids: 每个区域的中心,可以通过 centroids(label, 0) 访问 x, centroids(label, 1) 访问 y;
- connectivity: 4邻域或8邻域
- ltype: 输出标签类型 CV_32S 或者 CV_16U
- ccltype: 连通区域类型
- ConnectedComponentsAlgorithmsTypes
【参考】
- OpenCV 官方文档
