唐宇迪学习笔记18:案例——SVM调参实例
目录
一、SVM案例:线性支持向量机
SVM:支持向量机
支持向量基本原理
例子
Support Vector Machines: 最小化 雷区
训练一个基本的SVM
对比实验
二、软间隔C值对结果的影响
引入核函数的SVM
高维核变换
调节SVM参数: Soft Margin问题
调节C参数
三、模型复杂度的权衡
四、人脸识别实例
Example: Face Recognition
1、下载数据
2、降维后再SVM
3、使用grid search cross-validation来选择我们的参数
4、测试
5、查看
6、热度图
一、SVM案例:线性支持向量机
SVM:支持向量机
-
与传统算法进行对比,看看SVM究竟能带来什么样的效果
-
软间隔的作用,这么复杂的算法肯定会导致过拟合现象,如何来进行解决呢?
-
核函数的作用,如果只是做线性分类,好像轮不到SVM登场了,核函数才是它的强大之处!
支持向量基本原理
导包
%matplotlib inline
#为了在notebook中画图展示
import numpy as np
import matplotlib.pyplot as plt
from scipy import stats
import seaborn as sns; sns.set()
例子
#随机来点数据
#其中 cluster_std是数据的离散程度
from sklearn.datasets.samples_generator import make_blobs
X, y = make_blobs(n_samples=50, centers=2,
                  random_state=0, cluster_std=0.60)
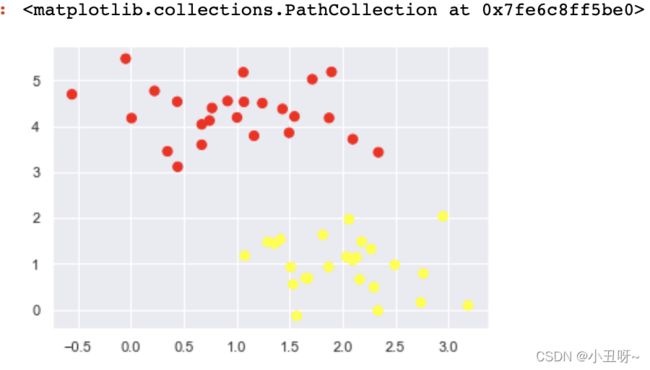
plt.scatter(X[:, 0], X[:, 1], c=y, s=50, cmap='autumn')#随便的画几条分割线,哪个好来这?
xfit = np.linspace(-1, 3.5)
plt.scatter(X[:, 0], X[:, 1], c=y, s=50, cmap='autumn')
for m, b in [(1, 0.65), (0.5, 1.6), (-0.2, 2.9)]:
plt.plot(xfit, m * xfit + b, '-k')
#限制一下X的取值范围
plt.xlim(-1, 3.5);Support Vector Machines: 最小化 雷区
xfit = np.linspace(-1, 3.5)
plt.scatter(X[:, 0], X[:, 1], c=y, s=50, cmap='autumn')

for m, b, d in [(1, 0.65, 0.33), (0.5, 1.6, 0.55), (-0.2, 2.9, 0.2)]:
    yfit = m * xfit + b
    plt.plot(xfit, yfit, '-k')
    plt.fill_between(xfit, yfit - d, yfit + d, edgecolor='none',
                     color='#AAAAAA', alpha=0.4)

plt.xlim(-1, 3.5);
训练一个基本的SVM
#分类任务
from sklearn.svm import SVC
#线性核函数 相当于不对数据进行变换
model = SVC(kernel='linear')
model.fit(X, y)
绘图函数(模板)
#绘图函数
def plot_svc_decision_function(model, ax=None, plot_support=True):

    if ax is None:
        ax = plt.gca()
    xlim = ax.get_xlim()
    ylim = ax.get_ylim()

    # 用SVM自带的decision_function函数来绘制
    x = np.linspace(xlim[0], xlim[1], 30)
    y = np.linspace(ylim[0], ylim[1], 30)
    Y, X = np.meshgrid(y, x)
    xy = np.vstack([X.ravel(), Y.ravel()]).T
    P = model.decision_function(xy).reshape(X.shape)

    # 绘制决策边界
    ax.contour(X, Y, P, colors='k',
               levels=[-1, 0, 1], alpha=0.5,
               linestyles=['--', '-', '--'])

    # 绘制支持向量
    if plot_support:
        ax.scatter(model.support_vectors_[:, 0],
                   model.support_vectors_[:, 1],
                   s=300, linewidth=1, alpha=0.2);
    ax.set_xlim(xlim)
    ax.set_ylim(ylim)
plt.scatter(X[:, 0], X[:, 1], c=y, s=50, cmap='autumn')
plot_svc_decision_function(model)-
这条线就是我们希望得到的决策边界啦
-
观察发现有3个点做了特殊的标记,它们恰好都是边界上的点
-
它们就是我们的support vectors(支持向量)
-
在Scikit-Learn中, 它们存储在这个位置
support_vectors_(一个属性)
model.support_vectors_-
观察可以发现,只需要支持向量我们就可以把模型构建出来
-
接下来我们尝试一下,用不同多的数据点,看看效果会不会发生变化
-
分别使用60个和120个数据点
对比实验
def plot_svm(N=10, ax=None):
    X, y = make_blobs(n_samples=200, centers=2,
                      random_state=0, cluster_std=0.60)
    X = X[:N]
    y = y[:N]
    model = SVC(kernel='linear', C=1E10)
    model.fit(X, y)

    ax = ax or plt.gca()
    ax.scatter(X[:, 0], X[:, 1], c=y, s=50, cmap='autumn')
    ax.set_xlim(-1, 4)
    ax.set_ylim(-1, 6)
    plot_svc_decision_function(model, ax)
# 分别对不同的数据点进行绘制
fig, ax = plt.subplots(1, 2, figsize=(16, 6))
fig.subplots_adjust(left=0.0625, right=0.95, wspace=0.1)
for axi, N in zip(ax, [60, 120]):
    plot_svm(N, axi)
axi.set_title('N = {0}'.format(N))- 左边是60个点的结果,右边的是120个点的结果
- 观察发现,只要支持向量没变,其他的数据怎么加无所谓!
二、软间隔C值对结果的影响
引入核函数的SVM
- 首先我们先用线性的核来看一下在下面这样比较难的数据集上还能分了吗?
from sklearn.datasets.samples_generator import make_circles
# 绘制另外一种数据集
X, y = make_circles(100, factor=.1, noise=.1)
#看看这回线性和函数能解决嘛
clf = SVC(kernel='linear').fit(X, y)

plt.scatter(X[:, 0], X[:, 1], c=y, s=50, cmap='autumn')
plot_svc_decision_function(clf, plot_support=False);
高维核变换
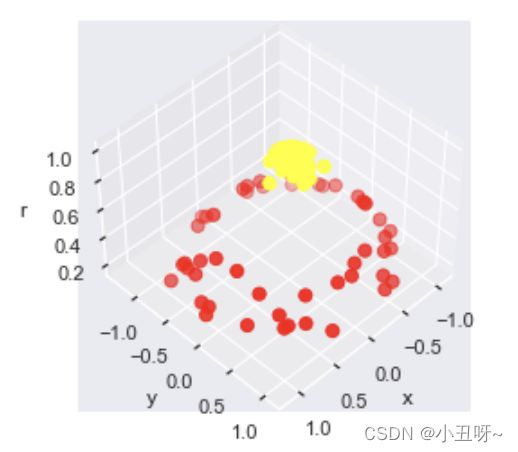
#加入了新的维度r
from mpl_toolkits import mplot3d
r = np.exp(-(X ** 2).sum(1))
# 可以想象一下在三维中把环形数据集进行上下拉伸
def plot_3D(elev=30, azim=30, X=X, y=y):
    ax = plt.subplot(projection='3d')
    ax.scatter3D(X[:, 0], X[:, 1], r, c=y, s=50, cmap='autumn')
    ax.view_init(elev=elev, azim=azim)
    ax.set_xlabel('x')
    ax.set_ylabel('y')
    ax.set_zlabel('r')

plot_3D(elev=45, azim=45, X=X, y=y)
#加入高斯核函数
clf = SVC(kernel='rbf')
clf.fit(X, y)#这回厉害了!
plt.scatter(X[:, 0], X[:, 1], c=y, s=50, cmap='autumn')
plot_svc_decision_function(clf)
plt.scatter(clf.support_vectors_[:, 0], clf.support_vectors_[:, 1],
s=300, lw=1, facecolors='none'); 使用这种核支持向量机,我们学习一个合适的非线性决策边界。这种核变换策略在机器学习中经常被使用!
调节SVM参数: Soft Margin问题
调节C参数
- 当C趋近于无穷大时:意味着分类严格不能有错误
- 当C趋近于很小的时:意味着可以有更大的错误容忍
# 这份数据集中cluster_std稍微大一些,这样才能体现出软间隔的作用
X, y = make_blobs(n_samples=100, centers=2,
                  random_state=0, cluster_std=0.8)
plt.scatter(X[:, 0], X[:, 1], c=y, s=50, cmap='autumn')
c=10和0.1
#加大游戏难度的数据集
X, y = make_blobs(n_samples=100, centers=2,
                  random_state=0, cluster_std=0.8)

fig, ax = plt.subplots(1, 2, figsize=(16, 6))
fig.subplots_adjust(left=0.0625, right=0.95, wspace=0.1)
# 选择两个C参数来进行对别实验,分别为10和0.1
for axi, C in zip(ax, [10.0, 0.1]):
    model = SVC(kernel='linear', C=C).fit(X, y)
    axi.scatter(X[:, 0], X[:, 1], c=y, s=50, cmap='autumn')
    plot_svc_decision_function(model, axi)
    axi.scatter(model.support_vectors_[:, 0],
                model.support_vectors_[:, 1],
                s=300, lw=1, facecolors='none');
    axi.set_title('C = {0:.1f}'.format(C), size=14)
三、模型复杂度的权衡
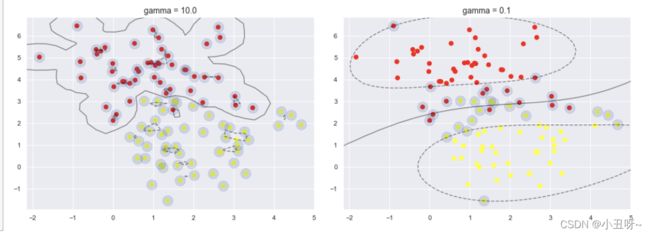
gamma值对结果的影响
X, y = make_blobs(n_samples=100, centers=2,
                  random_state=0, cluster_std=1.1)

fig, ax = plt.subplots(1, 2, figsize=(16, 6))
fig.subplots_adjust(left=0.0625, right=0.95, wspace=0.1)
# 选择不同的gamma值来观察建模效果
for axi, gamma in zip(ax, [10.0, 0.1]):
    model = SVC(kernel='rbf', gamma=gamma).fit(X, y)
    axi.scatter(X[:, 0], X[:, 1], c=y, s=50, cmap='autumn')
    plot_svc_decision_function(model, axi)
    axi.scatter(model.support_vectors_[:, 0],
                model.support_vectors_[:, 1],
                s=300, lw=1, facecolors='none');
axi.set_title('gamma = {0:.1f}'.format(gamma), size=14)gamma值小,简单模型。
四、人脸识别实例
Example: Face Recognition
As an example of support vector machines in action, let's take a look at the facial recognition problem. We will use the Labeled Faces in the Wild dataset, which consists of several thousand collated photos of various public figures. A fetcher for the dataset is built into Scikit-Learn.
1、下载数据
#读取数据集
from sklearn.datasets import fetch_lfw_people
faces = fetch_lfw_people(min_faces_per_person=60)
#看一下数据的规模
print(faces.target_names)
print(faces.images.shape)- 每个图的大小是 [62×47]
- 在这里我们就把每一个像素点当成了一个特征,但是这样特征太多了,用PCA降维一下吧!
2、降维后再SVM
from sklearn.svm import SVC
from sklearn.decomposition import PCA
from sklearn.pipeline import make_pipeline

#降维到150维
pca = PCA(n_components=150, whiten=True, random_state=42)
svc = SVC(kernel='rbf', class_weight='balanced')
#先降维然后再SVM
model = make_pipeline(pca, svc)
from sklearn.model_selection import train_test_split
Xtrain, Xtest, ytrain, ytest = train_test_split(faces.data, faces.target,
random_state=40)3、使用grid search cross-validation来选择我们的参数
from sklearn.model_selection import GridSearchCV
param_grid = {'svc__C': [1, 5, 10],
              'svc__gamma': [0.0001, 0.0005, 0.001]}
grid = GridSearchCV(model, param_grid)

%time grid.fit(Xtrain, ytrain)
print(grid.best_params_)
4、测试
model = grid.best_estimator_
yfit = model.predict(Xtest)
yfit.shape
5、查看
from sklearn.metrics import classification_report
print(classification_report(ytest, yfit,
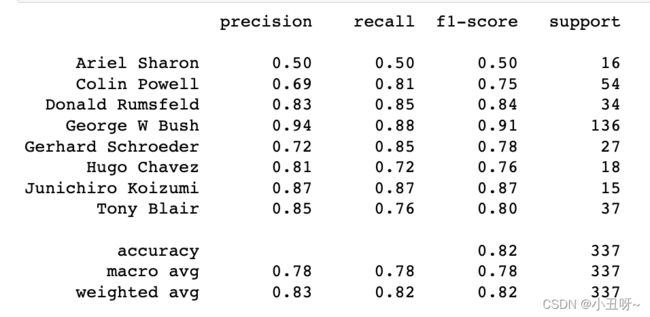
target_names=faces.target_names))- 精度(precision) = 正确预测的个数(TP)/被预测正确的个数(TP+FP)
- 召回率(recall)=正确预测的个数(TP)/预测个数(TP+FN)
- F1 = 2精度召回率/(精度+召回率)
6、热度图
from sklearn.metrics import confusion_matrix
mat = confusion_matrix(ytest, yfit)
sns.heatmap(mat.T, square=True, annot=True, fmt='d', cbar=False,
            xticklabels=faces.target_names,
            yticklabels=faces.target_names)
plt.xlabel('true label')
plt.ylabel('predicted label');


