Python-opencv fft、dct变换 + 幅度、相位谱结合实现艺术效果
1. 快速傅里叶变换(FFT)
原始二维傅里叶变换公式:
np工具箱中有fft2函数可以对图像做二维快速傅里叶变换(不断分解成更小的、更容易的小蝶形变换替换大变换),但是要让输出的频谱图更有视觉效果,需要把四个角的中心点移动到矩阵中心,并做对数变换
代码:
import numpy as np
import cv2
import matplotlib.pyplot as plt


def FFT(path):
    img = plt.imread(path)
    plt.subplot(121)
    plt.imshow(img)
    plt.title('img')
    # 转化为灰度图
    img = 0.2126 * img[:,:,0] + 0.7152 * img[:,:,1] + 0.0722 * img[:,:,2]
    # 快速傅里叶变换
    img_fft = np.fft.fft2(img)
    # 原点移动
    img_fft = np.fft.fftshift(img_fft)
    # 对数变换
    img_fft = np.log(1 + np.abs(img_fft))
    plt.subplot(122)
    plt.imshow(img_fft,'gray')
    plt.title('img_fft')
    plt.show()


FFT('man.jpg')
输出图像:(原图由网上下的人物图)
2. 离散余弦变换
原始二维离散余弦变换:
cv2工具箱中有dct函数可以实现对图像的二维离散余弦变换,通过经过对数变换可以更好地观察
代码:
import numpy as np
import cv2
import matplotlib.pyplot as plt


def DCT(path):
    img = cv2.imread(path, 0)
    img = img.astype('float32')
    plt.subplot(121)
    plt.imshow(img, cmap='gray')
    plt.title('img_gray')

    # 离散余弦变换
    img_dct = cv2.dct(img)
    # 对数变换
    img_dct = np.log(1+ np.abs(img_dct))
    plt.subplot(122)
    plt.imshow(img_dct, cmap='gray')
    plt.title('img_dct')
    plt.show()

DCT('man.jpg')
输出图像:
3. 相位谱、幅度谱结合
3.1. 相位谱、幅度谱提取:
相位谱、幅度谱定义:
代码:
import numpy as np
import cv2
from matplotlib import pyplot as plt

def magnitude_phase_split(img):
    # 分离幅度谱与相位谱
    dft = np.fft.fft2(img)
    dft_shift = np.fft.fftshift(dft)
    # 幅度谱
    magnitude_spectrum = np.abs(dft_shift)
    # 相位谱
    phase_spectrum = np.angle(dft_shift)
    return magnitude_spectrum,phase_spectrum
3.2. 不同图像的相位、幅度谱交替结合
图1的幅度谱和图2的相位谱结合,重构图像以图2信息为主
图2的幅度谱和图1的相位谱结合,重构图像以图1信息为主
代码:
def magnitude_phase_combine(img_m,img_p):
    # 不同图像幅度谱与相位谱结合
    img_mandp = img_m*np.e**(1j*img_p)
    # 图像重构
    img_mandp = np.uint8(np.abs(np.fft.ifft2(img_mandp)))
    img_mandp =img_mandp/np.max(img_mandp)*255
    return img_mandp

# 读取图像 主图和纹理图
img1 = cv2.imread("man.jpg",0)
img2= cv2.imread("rock1.jpg",0)

# 分离幅度谱与相位谱
img1_m,img1_p = magnitude_phase_split(img1)
img2_m,img2_p = magnitude_phase_split(img2)

# 合并幅度谱与相位谱
# 主图的幅度谱+纹理图的相位谱 以纹理图为主
img_1mAnd2p = magnitude_phase_combine(img1_m,img2_p)
# 纹理图的幅度谱+主图的相位谱 以主图为主
img_2mAnd1p = magnitude_phase_combine(img2_m,img1_p)

plt.figure(figsize=(10,8))
plt.subplot(321)
plt.xlabel("man")
plt.imshow(img1,cmap="gray")
plt.subplot(322)
plt.imshow(img2,cmap="gray")
plt.xlabel("rock")
plt.subplot(323)
plt.imshow(img_1mAnd2p,cmap="gray")
plt.xlabel("man_and_rock_p")
plt.subplot(324)
plt.imshow(img_2mAnd1p,cmap="gray")
plt.xlabel("rock_m_and_man_p")
plt.show()
输出结果:
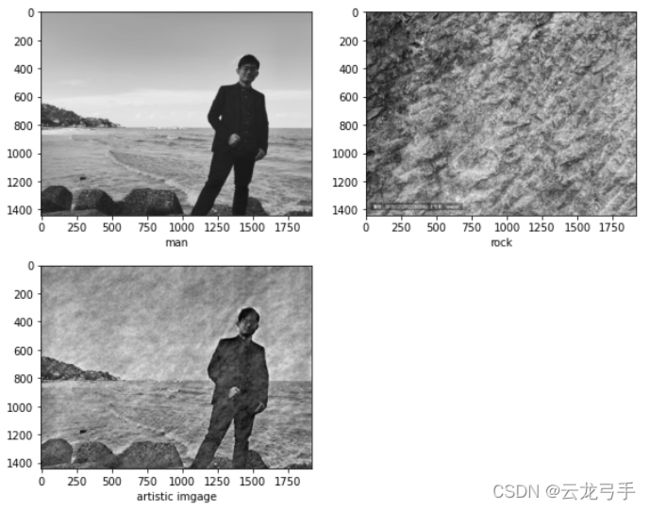
3.3. 不同图像相应谱结合实现艺术效果
由于相位谱内容占比决定最终图像中的信息占比,则通过加权相加并调节权重,可以实现在主图的基础上结合纹理图的纹理信息,从而得到艺术效果
代码:
def magnitude_phase_add(img1_m, img2_m, img1_p, img2_p):
    # 不同图像幅度谱和相位谱对应加权相加
    img_m = img1_m * 0.4 + img2_m * 0.6
    img_p = img1_p * (np.sum(img2_p) / (np.sum(img1_p) + np.sum(img2_p))) + img2_p * (np.sum(img1_p) / (np.sum(img1_p) + np.sum(img2_p)))
    # 图像重构
    img = img_m * np.e ** (1j * img_p)
    img = np.uint8(np.abs(np.fft.ifft2(img)))
    img = img / np.max(img) * 255
    return img


# 读取图像 主图和纹理图
img1 = cv2.imread("cqh.jpg",0)
img2= cv2.imread("rock1.jpg",0)

# 分离幅度谱与相位谱
img1_m,img1_p = magnitude_phase_split(img1)
img2_m,img2_p = magnitude_phase_split(img2)

# 合并幅度谱与相位谱
# 主图和纹理图相应谱加权像家 以主图为主,以纹理图为辅,形成艺术效果
img_add = magnitude_phase_add(img1_m, img2_m, img1_p, img2_p)

plt.figure(figsize=(10,8))
plt.subplot(221)
plt.xlabel("cqh")
plt.imshow(img1,cmap="gray")
plt.subplot(222)
plt.imshow(img2,cmap="gray")
plt.xlabel("rock")
plt.subplot(223)
plt.imshow(img_add,cmap="gray")
plt.xlabel("artistic imgage")
plt.show()
输出结果:
参考博文:
两幅图像幅度谱和相位谱替换_陨星落云的博客-CSDN博客


