sklearn基于轮廓系数来选择n_clusters
通常使用绘制轮廓系数分布图和聚类后的数据分布图来选择最佳的n_clusters。
from sklearn.cluster import KMeans
from sklearn.metrics import silhouette_samples, silhouette_score
from sklearn.datasets import make_blobs
import matplotlib.pyplot as plt
import matplotlib.cm as cm
import numpy as np

X, y = make_blobs(n_samples=500, n_features=2, centers=4, random_state=1)

n_clusters = 4
fig, (ax1, ax2) = plt.subplots(1, 2)
fig.set_size_inches(18, 7)
ax1.set_xlim([-0.1, 1])
ax1.set_ylim([0, X.shape[0] + (n_clusters + 1) * 10])
clusterer = KMeans(n_clusters=n_clusters, random_state=10).fit(X)
cluster_labels = clusterer.labels_

silhouette_avg = silhouette_score(X, cluster_labels)
print("For n_clusters =", n_clusters, "The average silhouette_score is :", silhouette_avg)

sample_silhouette_values = silhouette_samples(X, cluster_labels)

y_lower = 10

for i in range(n_clusters):
    ith_cluster_silhouette_values = sample_silhouette_values[cluster_labels == i]
    ith_cluster_silhouette_values.sort()
    size_cluster_i = ith_cluster_silhouette_values.shape[0]
    y_upper = y_lower + size_cluster_i
    color = cm.nipy_spectral(float(i) / n_clusters)
    ax1.fill_betweenx(np.arange(y_lower, y_upper)
                      , ith_cluster_silhouette_values
                      , facecolor=color
                      , alpha=0.7
                      )
    ax1.text(-0.05
             , y_lower + 0.5 * size_cluster_i
             , str(i)
             )
    ax1.text(-0.05
             , y_lower + 0.5 * size_cluster_i
             , str(i)
             )
    y_lower = y_upper + 10

ax1.set_title("The silhouette plot for the various clusters.")
ax1.set_xlabel("The silhouette coefficient values")
ax1.set_ylabel("Cluster label")
ax1.axvline(x=silhouette_avg, color="red", linestyle="--")
ax1.set_yticks([])
ax1.set_xticks([-0.1, 0, 0.2, 0.4, 0.6, 0.8, 1])
colors = cm.nipy_spectral(cluster_labels.astype(float) / n_clusters)
ax2.scatter(X[:, 0], X[:, 1]
            , marker='o'  # 点的形状
            , s=8  # 点的大小
            , c=colors)
centers = clusterer.cluster_centers_
ax2.scatter(centers[:, 0], centers[:, 1], marker='x',
            c="red", alpha=1, s=200)
ax2.set_title("The visualization of the clustered data.")
ax2.set_xlabel("Feature space for the 1st feature")
ax2.set_ylabel("Feature space for the 2nd feature")
plt.suptitle(("Silhouette analysis for KMeans clustering on sample data "
              "with n_clusters = %d" % n_clusters),
             fontsize=14, fontweight='bold')
plt.show()

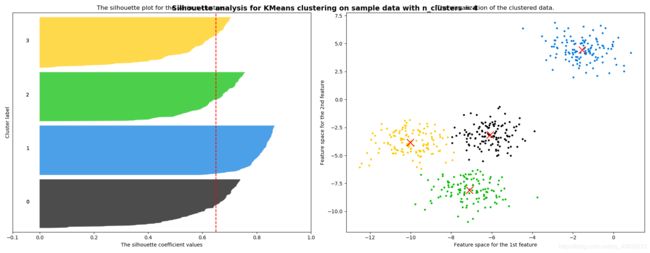
这个是n_clusters==4是的cm轮廓图和pyplot点图
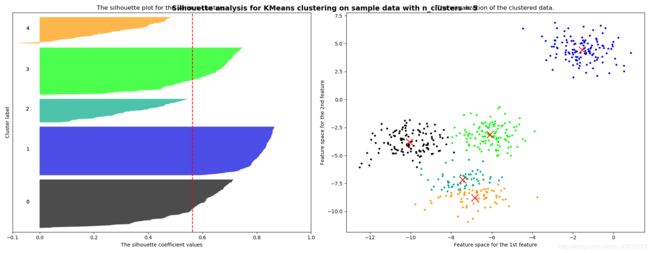
将上面的过程包装成一个循环,可以得到:
在n_clusters中,加入了一层循环
from sklearn.cluster import KMeans
from sklearn.metrics import silhouette_samples, silhouette_score
from sklearn.datasets import make_blobs
import matplotlib.pyplot as plt
import matplotlib.cm as cm
import numpy as np

X, y = make_blobs(n_samples=500, n_features=2, centers=4, random_state=1)

for n_clusters in [2,3,4,5,6,7]:
    fig, (ax1, ax2) = plt.subplots(1, 2)
    fig.set_size_inches(18, 7)
    ax1.set_xlim([-0.1, 1])
    ax1.set_ylim([0, X.shape[0] + (n_clusters + 1) * 10])
    clusterer = KMeans(n_clusters=n_clusters, random_state=10).fit(X)
    cluster_labels = clusterer.labels_

    silhouette_avg = silhouette_score(X, cluster_labels)
    print("For n_clusters =", n_clusters, "The average silhouette_score is :", silhouette_avg)

    sample_silhouette_values = silhouette_samples(X, cluster_labels)

    y_lower = 10

    for i in range(n_clusters):
        ith_cluster_silhouette_values = sample_silhouette_values[cluster_labels == i]
        ith_cluster_silhouette_values.sort()
        size_cluster_i = ith_cluster_silhouette_values.shape[0]
        y_upper = y_lower + size_cluster_i
        color = cm.nipy_spectral(float(i) / n_clusters)
        ax1.fill_betweenx(np.arange(y_lower, y_upper)
                          , ith_cluster_silhouette_values
                          , facecolor=color
                          , alpha=0.7
                          )
        ax1.text(-0.05
                 , y_lower + 0.5 * size_cluster_i
                 , str(i)
                 )
        ax1.text(-0.05
                 , y_lower + 0.5 * size_cluster_i
                 , str(i)
                 )
        y_lower = y_upper + 10

    ax1.set_title("The silhouette plot for the various clusters.")
    ax1.set_xlabel("The silhouette coefficient values")
    ax1.set_ylabel("Cluster label")
    ax1.axvline(x=silhouette_avg, color="red", linestyle="--")
    ax1.set_yticks([])
    ax1.set_xticks([-0.1, 0, 0.2, 0.4, 0.6, 0.8, 1])
    colors = cm.nipy_spectral(cluster_labels.astype(float) / n_clusters)
    ax2.scatter(X[:, 0], X[:, 1]
                , marker='o'  # 点的形状
                , s=8  # 点的大小
                , c=colors)
    centers = clusterer.cluster_centers_
    ax2.scatter(centers[:, 0], centers[:, 1], marker='x',
                c="red", alpha=1, s=200)
    ax2.set_title("The visualization of the clustered data.")
    ax2.set_xlabel("Feature space for the 1st feature")
    ax2.set_ylabel("Feature space for the 2nd feature")
    plt.suptitle(("Silhouette analysis for KMeans clustering on sample data "
                  "with n_clusters = %d" % n_clusters),
                 fontsize=14, fontweight='bold')
    plt.show()
- 共生成了6组图,左边的图是轮廓系数的取值,每个颜色代表一个簇。
- 右边的图是聚类分布图。
- 4个和2个分类情况,需要根据不同的实际情况来分析。(业务水平)