logistic回归
定义:
logistic回归是一种广义线性回归(generalized linear model),因此与多重线性回归分析有很多相同之处。它们的模型形式基本上相同,都具有 w'x+b,其中w和b是待求参数,其区别在于他们的因变量不同,多重线性回归直接将w'x+b作为因变量,即y =w'x+b,而logistic回归则通过函数L将w'x+b对应一个隐状态p,p =L(w'x+b),然后根据p 与1-p的大小决定因变量的值。如果L是logistic函数,就是logistic回归,如果L是多项式函数就是多项式回归。
logistic回归的因变量可以是二分类的,也可以是多分类的,但是二分类的更为常用,也更加容易解释,多类可以使用softmax方法进行处理。实际中最为常用的就是二分类的logistic回归。
Logistic回归模型的适用条件
1 因变量为二分类的分类变量或某事件的发生率,并且是数值型变量。但是需要注意,重复计数现象指标不适用于Logistic回归。
2 残差和因变量都要服从二项分布。二项分布对应的是分类变量,所以不是正态分布,进而不是用最小二乘法,而是最大似然法来解决方程估计和检验问题。
3 自变量和Logistic概率是线性关系
4 各观测对象间相互独立。
原理:如果直接将线性回归的模型扣到Logistic回归中,会造成方程二边取值区间不同和普遍的非直线关系。因为Logistic中因变量为二分类变量,某个概率作为方程的因变量估计值取值范围为0-1,但是,方程右边取值范围是无穷大或者无穷小。所以,才引入Logistic回归
准备:
首先,线性回归不适合于各类数据。从下面的图中我们可以观察到,第一张是线性回归的图,第二张也是线性的,但有二元类别值。从这两张图中我们可以看到,第一张图的数值是线性的,即自变量增加,因变量也会增加。但是,第二张图因变量只有两个值,非 "0 "即 "1"。
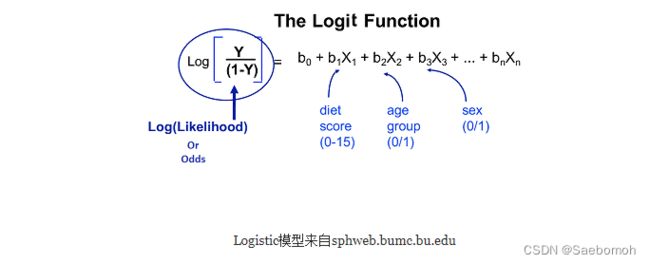
Logit回归模型如下所示:
准备测试数据:
class LogisticRegression:
    def __init__(self,data,labels,polynomial_degree = 0,sinusoid_degree = 0,normalize_data=False):
        """
        1.对数据进行预处理操作
        2.先得到所有的特征个数
        3.初始化参数矩阵
        """
        (data_processed,
         features_mean,
         features_deviation)  = prepare_for_training(data, polynomial_degree, sinusoid_degree,normalize_data=False)

        self.data = data_processed
        self.labels = labels
        self.unique_labels = np.unique(labels)
        self.features_mean = features_mean
        self.features_deviation = features_deviation
        self.polynomial_degree = polynomial_degree
        self.sinusoid_degree = sinusoid_degree
        self.normalize_data = normalize_data

        num_features = self.data.shape[1]
        num_unique_labels = np.unique(labels).shape[0]
        self.theta = np.zeros((num_unique_labels,num_features))

    def train(self,max_iterations=1000):
        cost_histories = []
        num_features = self.data.shape[1]
        for label_index,unique_label in enumerate(self.unique_labels):
            current_initial_theta = np.copy(self.theta[label_index].reshape(num_features,1))
            current_lables = (self.labels == unique_label).astype(float)
            (current_theta,cost_history) = LogisticRegression.gradient_descent(self.data,current_lables,current_initial_theta,max_iterations)
            self.theta[label_index] = current_theta.T
            cost_histories.append(cost_history)

        return self.theta,cost_histories


    def gradient_descent(data,labels,current_initial_theta,max_iterations):
        cost_history = []
        num_features = data.shape[1]
        result = minimize(
            #要优化的目标:
            #lambda current_theta:LogisticRegression.cost_function(data,labels,current_initial_theta.reshape(num_features,1)),
            lambda current_theta:LogisticRegression.cost_function(data,labels,current_theta.reshape(num_features,1)),
            #初始化的权重参数
            current_initial_theta,
            #选择优化策略
            method = 'CG',
            # 梯度下降迭代计算公式
            #jac = lambda current_theta:LogisticRegression.gradient_step(data,labels,current_initial_theta.reshape(num_features,1)),
            jac = lambda current_theta:LogisticRegression.gradient_step(data,labels,current_theta.reshape(num_features,1)),
            # 记录结果
            callback = lambda current_theta:cost_history.append(LogisticRegression.cost_function(data,labels,current_theta.reshape((num_features,1)))),
            # 迭代次数
            options={'maxiter': max_iterations}
            )
        if not result.success:
            raise ArithmeticError('Can not minimize cost function'+result.message)
        optimized_theta = result.x.reshape(num_features,1)
        return optimized_theta,cost_history


    def cost_function(data,labels,theat):
        num_examples = data.shape[0]
        predictions = LogisticRegression.hypothesis(data,theat)
        y_is_set_cost = np.dot(labels[labels == 1].T,np.log(predictions[labels == 1]))
        y_is_not_set_cost = np.dot(1-labels[labels == 0].T,np.log(1-predictions[labels == 0]))
        cost = (-1/num_examples)*(y_is_set_cost+y_is_not_set_cost)
        return cost

    def hypothesis(data,theat):

        predictions = sigmoid(np.dot(data,theat))

        return  predictions


    def gradient_step(data,labels,theta):
        num_examples = labels.shape[0]
        predictions = LogisticRegression.hypothesis(data,theta)
        label_diff = predictions- labels
        gradients = (1/num_examples)*np.dot(data.T,label_diff)

        return gradients.T.flatten()

    def predict(self,data):
        num_examples = data.shape[0]
        data_processed = prepare_for_training(data, self.polynomial_degree, self.sinusoid_degree,self.normalize_data)[0]
        prob = LogisticRegression.hypothesis(data_processed,self.theta.T)
        max_prob_index = np.argmax(prob, axis=1)
        class_prediction = np.empty(max_prob_index.shape,dtype=object)
        for index,label in enumerate(self.unique_labels):
            class_prediction[max_prob_index == index] = label
        return class_prediction.reshape((num_examples,1))
使用的是加载sklearn内置数据集:鸢尾花数据集
代价函数
在统计学中,常常使用极大似然估计法来求解,即找到一组参数,使得在这组参数下,我们的数据的似然度(概率)最大。
由上可知,所谓最大似然估计是指通过求似然函数 L(θ)L(θ)的最大(或极大)值点来估计参数 θ的一种方法。 另外,最大似然估计对总体中未知参数的个数没有要求,可以求一个未知参数的最大似然估计,也可以一次求多个未知参数的最大似然估计,这个通过对多个未知参数求偏导来实现,因为多变量极值就是偏导运算。在机器学习中我们有损失函数的概念,其衡量的是模型预测错误的程度。如果取整个数据集上的平均对数似然损失,我们可以得到:
梯度上升算法求解logistic回归模型参数:
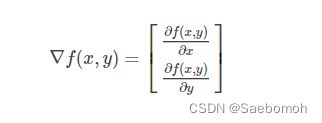
1. 梯度
函数f(x,y)f(x,y)的梯度的公式如下:
2. 梯度上升算法的原理
梯度上升算法的迭代公式如下:
上面的公式一直被迭代执行,直到符合某个条件为止。
代码部分:
from sklearn import datasets //加载花数据集
iris = datasets.load_iris()
list(iris.keys())
print (iris.DESCR)
X = iris['data'][:,3:]
y = (iris['target'] == 2).astype(np.int)
from sklearn.linear_model import LogisticRegression
log_res = LogisticRegression()
log_res.fit(X,y)
X_new = np.linspace(0,3,1000).reshape(-1,1)
y_proba = log_res.predict_proba(X_new)
//随着输入特征数值的变化,结果概率值也会随之变化
plt.figure(figsize=(12,5))
decision_boundary = X_new[y_proba[:,1]>=0.5][0]
plt.plot([decision_boundary,decision_boundary],[-1,2],'k:',linewidth = 2)
plt.plot(X_new,y_proba[:,1],'g-',label = 'Iris-Virginica')
plt.plot(X_new,y_proba[:,0],'b--',label = 'Not Iris-Virginica')
plt.arrow(decision_boundary,0.08,-0.3,0,head_width = 0.05,head_length=0.1,fc='b',ec='b')
plt.arrow(decision_boundary,0.92,0.3,0,head_width = 0.05,head_length=0.1,fc='g',ec='g')
plt.text(decision_boundary+0.02,0.15,'Decision Boundary',fontsize = 16,color = 'k',ha='center')
plt.xlabel('Peta width(cm)',fontsize = 16)
plt.ylabel('y_proba',fontsize = 16)
plt.axis([0,3,-0.02,1.02])
plt.legend(loc = 'center left',fontsize = 16)
print (help(plt.arrow))
X = iris['data'][:,(2,3)]
y = (iris['target']==2).astype(np.int)
from sklearn.linear_model import LogisticRegression
log_res = LogisticRegression(C = 10000)
log_res.fit(X,y)
//决策分类
import numpy as np
import pandas as pd
import matplotlib.pyplot as plt

from logistic_regression import LogisticRegression


data = pd.read_csv('../data/iris.csv')
iris_types = ['SETOSA','VERSICOLOR','VIRGINICA']

x_axis = 'petal_length'
y_axis = 'petal_width'

for iris_type in iris_types:
    plt.scatter(data[x_axis][data['class']==iris_type],
                data[y_axis][data['class']==iris_type],
                label = iris_type
                )
plt.show()

num_examples = data.shape[0]
x_train = data[[x_axis,y_axis]].values.reshape((num_examples,2))
y_train = data['class'].values.reshape((num_examples,1))

max_iterations = 1000
polynomial_degree = 0
sinusoid_degree = 0


logistic_regression = LogisticRegression(x_train,y_train,polynomial_degree,sinusoid_degree)
thetas,cost_histories = logistic_regression.train(max_iterations)
labels = logistic_regression.unique_labels

plt.plot(range(len(cost_histories[0])),cost_histories[0],label = labels[0])
plt.plot(range(len(cost_histories[1])),cost_histories[1],label = labels[1])
plt.plot(range(len(cost_histories[2])),cost_histories[2],label = labels[2])
plt.show()

y_train_prections = logistic_regression.predict(x_train)
precision = np.sum(y_train_prections == y_train)/y_train.shape[0] * 100
print ('precision:',precision)

x_min = np.min(x_train[:,0])
x_max = np.max(x_train[:,0])
y_min = np.min(x_train[:,1])
y_max = np.max(x_train[:,1])
samples= 150
X = np.linspace(x_min,x_max,samples)
Y = np.linspace(y_min,y_max,samples)

Z_SETOSA = np.zeros((samples,samples))
Z_VERSICOLOR = np.zeros((samples,samples))
Z_VIRGINICA = np.zeros((samples,samples))

for x_index,x in enumerate(X):
    for y_index,y in enumerate(Y):
        data = np.array([[x,y]])
        prediction = logistic_regression.predict(data)[0][0]
        if prediction == 'SETOSA':
            Z_SETOSA[x_index][y_index] =1
        elif prediction == 'VERSICOLOR':
            Z_VERSICOLOR[x_index][y_index] =1
        elif prediction == 'VIRGINICA':
            Z_VIRGINICA[x_index][y_index] =1

for iris_type in iris_types:
    plt.scatter(
        x_train[(y_train == iris_type).flatten(),0],
        x_train[(y_train == iris_type).flatten(),1],
        label = iris_type
                )

plt.contour(X,Y,Z_SETOSA)
plt.contour(X,Y,Z_VERSICOLOR)
plt.contour(X,Y,Z_VIRGINICA)
plt.show()
x0,x1 = np.meshgrid(np.linspace(1,2,2).reshape(-1,1),np.linspace(10,20,3).reshape(-1,1))
np.c_[x0.ravel(),x1.ravel()]
x0,x1 = np.meshgrid(np.linspace(2.9,7,500).reshape(-1,1),np.linspace(0.8,2.7,200).reshape(-1,1))
X_new = np.c_[x0.ravel(),x1.ravel()]
X_new
X_new.shape
y_proba = log_res.predict_proba(X_new)
plt.figure(figsize=(10,4))
plt.plot(X[y==0,0],X[y==0,1],'bs')
plt.plot(X[y==1,0],X[y==1,1],'g^')

zz = y_proba[:,1].reshape(x0.shape)
contour = plt.contour(x0,x1,zz,cmap=plt.cm.brg)
plt.clabel(contour,inline = 1)
plt.axis([2.9,7,0.8,2.7])
plt.text(3.5,1.5,'NOT Vir',fontsize = 16,color = 'b')
plt.text(6.5,2.3,'Vir',fontsize = 16,color = 'g')
非线性决策分类代码:
import numpy as np
import pandas as pd
import matplotlib.pyplot as plt
import math


# 类别标签
validities = [0, 1]

# 选择两个特征
x_axis = 'param_1'
y_axis = 'param_2'

# 散点图
for validity in validities:
    plt.scatter(
        data[x_axis][data['validity'] == validity],
        data[y_axis][data['validity'] == validity],
        label=validity
    )

plt.xlabel(x_axis)
plt.ylabel(y_axis)
plt.title('Microchips Tests')
plt.legend()
plt.show()


num_examples = data.shape[0]
x_train = data[[x_axis, y_axis]].values.reshape((num_examples, 2))
y_train = data['validity'].values.reshape((num_examples, 1))

# 训练参数
max_iterations = 100000
regularization_param = 0
polynomial_degree = 5
sinusoid_degree = 0
# 逻辑回归
logistic_regression = LogisticRegression(x_train, y_train, polynomial_degree, sinusoid_degree)

# 训练
(thetas, costs) = logistic_regression.train(max_iterations)

columns = []
for theta_index in range(0, thetas.shape[1]):
    columns.append('Theta ' + str(theta_index));

# 训练结果
labels = logistic_regression.unique_labels

plt.plot(range(len(costs[0])), costs[0], label=labels[0])
plt.plot(range(len(costs[1])), costs[1], label=labels[1])

plt.xlabel('Gradient Steps')
plt.ylabel('Cost')
plt.legend()
plt.show()

# 预测
y_train_predictions = logistic_regression.predict(x_train)

# 准确率
precision = np.sum(y_train_predictions == y_train) / y_train.shape[0] * 100

print('Training Precision: {:5.4f}%'.format(precision))


num_examples = x_train.shape[0]
samples = 150
x_min = np.min(x_train[:, 0])
x_max = np.max(x_train[:, 0])

y_min = np.min(x_train[:, 1])
y_max = np.max(x_train[:, 1])

X = np.linspace(x_min, x_max, samples)
Y = np.linspace(y_min, y_max, samples)
Z = np.zeros((samples, samples))

# 结果展示
for x_index, x in enumerate(X):
    for y_index, y in enumerate(Y):
        data = np.array([[x, y]])
        Z[x_index][y_index] = logistic_regression.predict(data)[0][0]

positives = (y_train == 1).flatten()
negatives = (y_train == 0).flatten()

plt.scatter(x_train[negatives, 0], x_train[negatives, 1], label='0')
plt.scatter(x_train[positives, 0], x_train[positives, 1], label='1')

plt.contour(X, Y, Z)

plt.xlabel('param_1')
plt.ylabel('param_2')
plt.title('Microchips Tests')
plt.legend()

plt.show()
结果展示:
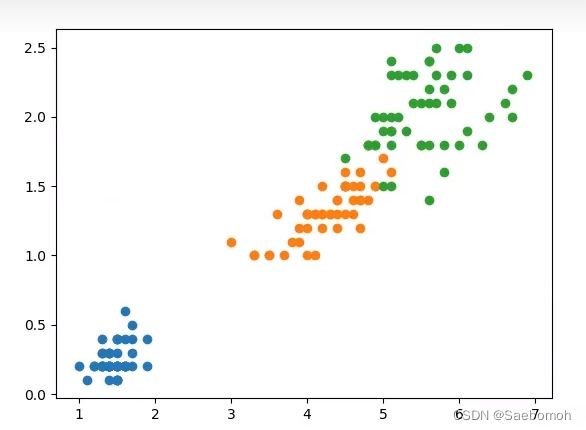
原本数据分布点:
线性的
因为这个类别有三个,图片结果由原始数据进行标准化操作之后才能分类出来。
结果是由多次的分类操作得出的也就是说
第一个操作分界线是将蓝色和(橙色绿色)划分
第二次操作分界线是将橙色和(蓝色绿色)划分相当于切两刀
第三次操作分界线是将绿色和(蓝色橙色)划分
总之就是将三个二分类任务转换成一个多分类任务。
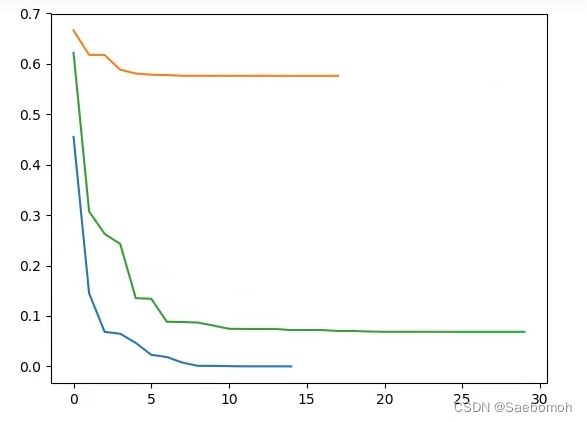
loss值:
可以看出对于橙色线的误差要大于蓝色和绿色,因为它处于中间地带,一次要画出两个决策线,而边缘的两个分类样本每次只划分一个线,所以它的误差会比较大,三条线训练过程中误差都在逐渐减少。
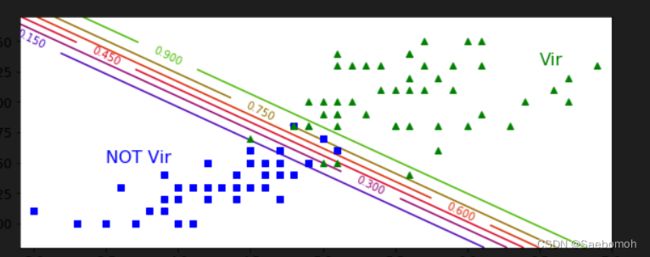
这个就是画出等高线判断出是否属于VIr类的简单二分类问题
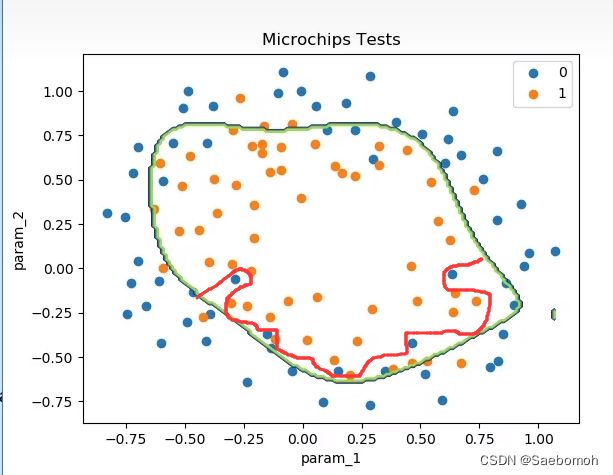
非线性的:
这张图可以看出逻辑回归不仅可以处理出线性边界还能处理非线性边界,但是我们可以看见这个数据集准确性不高,其中有几个点是画圈的都属于异常点,如果说你再给他训练好一点能发现,它就很可能会:
过拟合化,所以说这个数据集本身存在噪声离心点,导致准确度没那么高,但是整体效果看起来还是可以实现个大概!
参考:
1.唐宇迪 机器学习教程

