Matplotlib常用的可视化作图
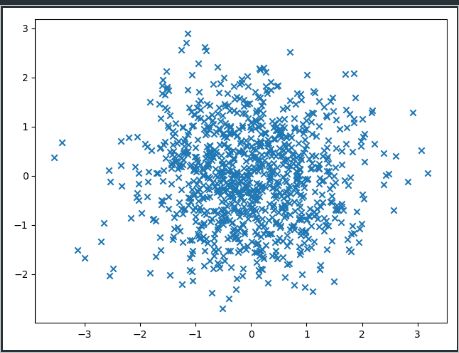
1、散点图
import numpy as np
import pandas as pd
import matplotlib.pyplot as plt
import seaborn as sns
N = 1000
x = np.random.randn(N)
y = np.random.randn(N)
plt.scatter(x,y,marker='x')
plt.show()
df = pd.DataFrame({'x':x,'y':y})
sns.jointplot(x='x',y='y',data=df,kind='scatter')
plt.show()

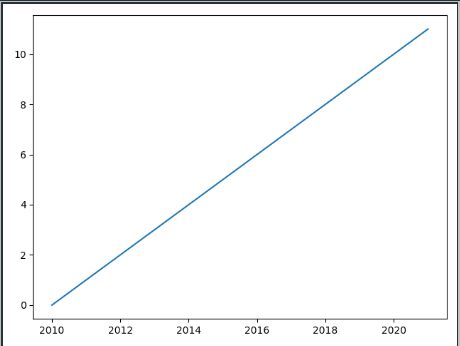
2、折线图
import numpy as np
import pandas as pd
import matplotlib.pyplot as plt
import seaborn as sns
x = [i for i in range(2010,2022)]
y = [i for i in range(12)]
plt.plot(x,y)
plt.show()
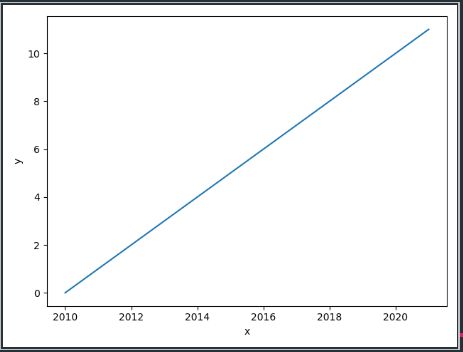
df = pd.DataFrame({'x':x,'y':y})
sns.lineplot(x='x',y='y',data=df)
plt.show()
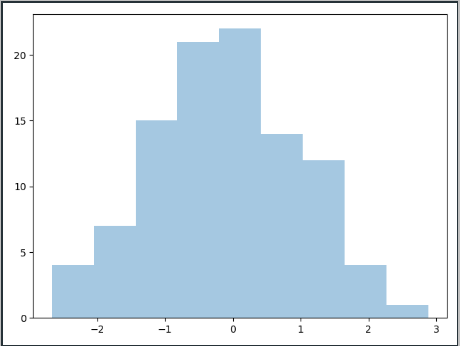
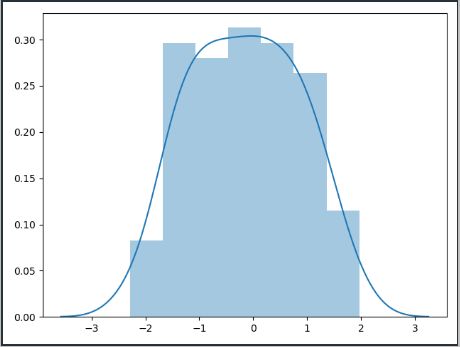
3、直方图
import numpy as np
import pandas as pd
import matplotlib.pyplot as plt
import seaborn as sns
a = np.random.randn(100)
s = pd.Series(a)
plt.hist(s)
plt.show()
sns.distplot(s,kde=False)
plt.show()
sns.distplot(s,kde=True)
plt.show()

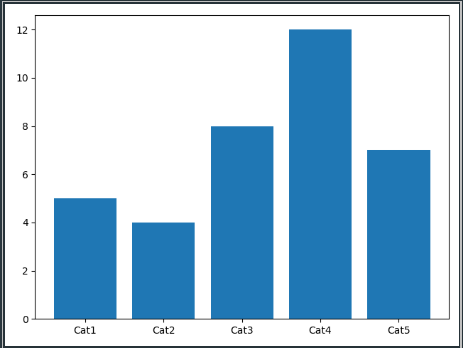
4、条形图
import numpy as np
import pandas as pd
import matplotlib.pyplot as plt
import seaborn as sns
x = ['Cat1','Cat2','Cat3','Cat4','Cat5']
y = [5,4,8,12,7]
plt.bar(x,y)
plt.show()
sns.barplot(x,y)
plt.show()

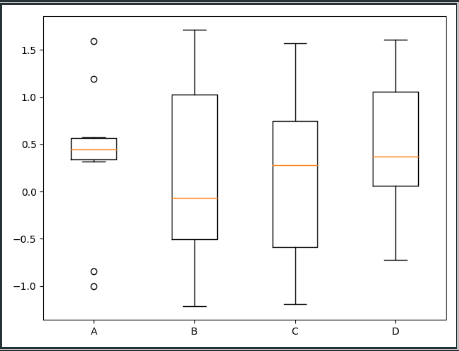
5、箱线图
import numpy as np
import pandas as pd
import matplotlib.pyplot as plt
import seaborn as sns
data = np.random.normal(size=(10,4))
labels = ['A','B','C','D']
plt.boxplot(data,labels=labels)
plt.show()
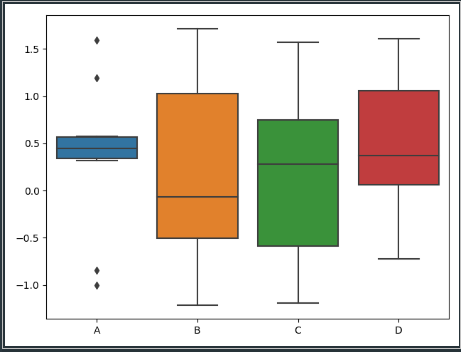
df = pd.DataFrame(data,columns=labels)
sns.boxplot(data=df)
plt.show()
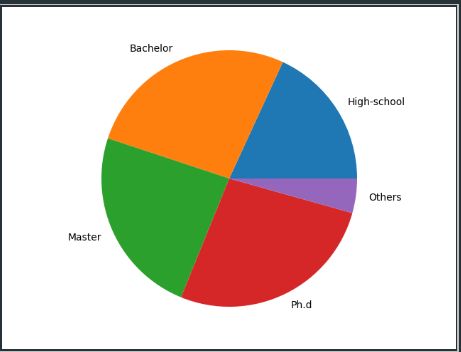
6、饼图
import numpy as np
import pandas as pd
import matplotlib.pyplot as plt
import seaborn as sns
nums = [25,37,33,37,6]
labels = ['High-school','Bachelor','Master','Ph.d','Others']
plt.pie(x=nums,labels=labels)
plt.show()
7、热力图
import numpy as np
import pandas as pd
import matplotlib.pyplot as plt
import seaborn as sns
flights = sns.load_dataset('flights')
data = flights.pivot('year','month','passengers')
sns.heatmap(data)
plt.show()

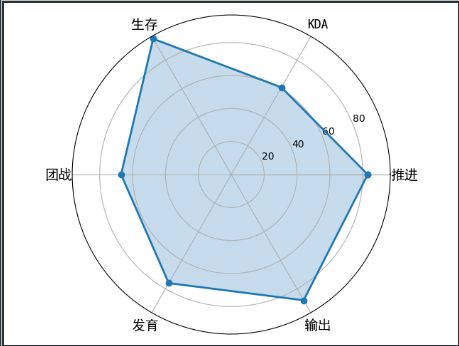
8、雷达图
import numpy as np
import pandas as pd
import matplotlib.pyplot as plt
import seaborn as sns
from matplotlib.font_manager import FontProperties
labels = np.array([u'推进','KDA',u'生存',u'团战',u'发育',u'输出'])
stats = [83,61,95,67,76,88]
angles = np.linspace(0,2*np.pi,len(labels),endpoint=False)
stats = np.concatenate((stats,[stats[0]]))
angles = np.concatenate((angles,[angles[0]]))
fig = plt.figure()
ax = fig.add_subplot(111,polar=True)
ax.plot(angles,stats,'o-',linewidth=2)
ax.fill(angles,stats,alpha=0.25)
font = FontProperties(fname=r'C:\Windows\Fonts\simhei.ttf',size=14)
ax.set_thetagrids(angles * 180/np.pi,labels,FontProperties=font)
plt.show()
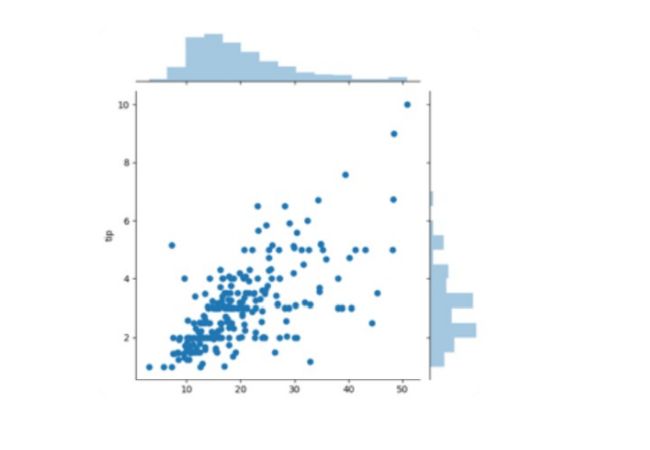
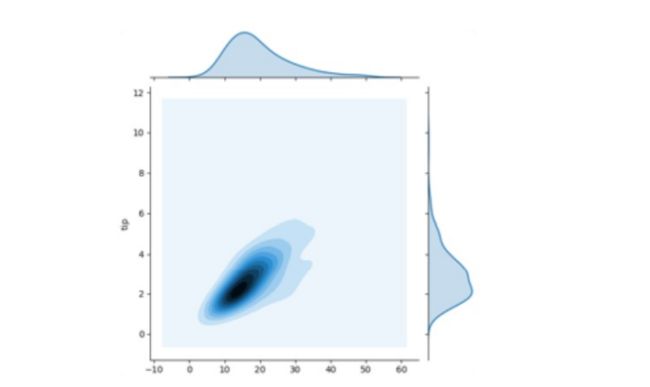
9、二元变量分布
import numpy as np
import pandas as pd
import matplotlib.pyplot as plt
import seaborn as sns
from matplotlib.font_manager import FontProperties
tips = sns.load_dataset('tips')
sns.jointplot(x='total_bill',y='tip',data=tips,kind='scatter')
sns.jointplot(x='total_bill',y='tip',data=tips,kind='kde')
sns.jointplot(x='total_bill',y='tip',data=tips,kind='hex')
plt.show()

10、成对关系
import numpy as np
import pandas as pd
import matplotlib.pyplot as plt
import seaborn as sns
from matplotlib.font_manager import FontProperties
iris= sns.load_dataset('iris')
sns.pairplot(iris)
plt.show()