【R语言】——聚类热图行列分组信息注释热图2
上一期”【R语言】——聚类热图绘制(pheatmap)“介绍了R语言pheatmap包绘制聚类热图的基础代码,本期介绍当需要同时在热图上显示分组情况时,可利用pheatmap包构建分组信息,从而以不同的颜色等方式来展现分组情况。
1 数据准备
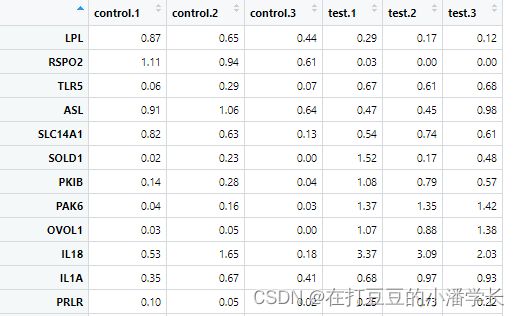
数据输入格式(csv格式):
2 R包加载及数据导入
#下载包#

install.packages("pheatmap")

install.packages("RColorBrewer")

#加载包#

library("pheatmap")

library("RColorBrewer")

#加载绘图数据#

data<-read.table(file='C:/Rdata/jc/pheatmap.csv',header=TRUE,row.names= 1,sep=',')

head(data) #查看数据
#data=log2(data[,1:6]+1) #对基因表达量数据处理
#data <- as.matrix(data) #转变为matrix格式矩阵
#head(data)3 分组热图的绘制
首先需要对分组对象进行注释,随后使用“annotation_row”、“annotation_col”、“annotation_colors”、“annotation_legend”、“annotation_names_row”和“annotation_names_col”分别对行和列进行注释、行和列注释的颜色、图例信息注释显示、行和列注释的名称显示
3.1 简单分组
3.1.1 列信息注释及热图绘制
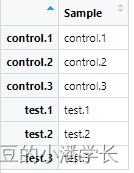
ann_col = data.frame(Sample=factor(c(rep("control.1",1),rep("control.2",1),rep("control.3",1),rep("test.1",1),rep("test.2",1),rep("test.3",1))))#创建分组列

row.names(ann_col) = colnames(data) #这一行必须有,否则会报错:Error in check.length("fill") :  'gpar' element 'fill' must not be length 0

ann_color = list(Sample = c(control.1="#0089CF", control.2="#0081A1", control.3="#007360",test.1="#E889BD", test.2="#B286D7", test.3="#5189E0")) #定义分组颜色
pheatmap(data, scale = "row", #表示进行均一化的方向,值为 “row”, “column” 或者"none"
cluster_rows = T,cluster_cols = T, #cluster_rows表示仅对行聚类,cluster_cols表示仅对列聚类,值为TRUE或FALSE
cutree_rows = NA, cutree_cols = NA, #若进行了行/列聚类,根据行/列聚类数量分隔热图行,cutree_rows=num分割行,cutree_cols=num分割列
treeheight_row = 30, treeheight_col = 30, #若行、列聚类树高度调整
border_color = "grey60", #表示热图每个小的单元格边框的颜色,默认为 "grey60"
cellwidth = 60, cellheight = 7.5, #表示单个单元格的宽度\高度,默认为 “NA”
display_numbers = F, #表示是否在单元格上显示原始数值或按照特殊条件进行区分标记
fontsize_number = 6, #表示热图上显示数字的字体大小
number_format = "%.2f", #表示热图单元格上显示的数据格式,“%.2f” 表示两位小数,“%.1e”表示科学计数法
number_color = "grey30", #表示热图单元格上显示的数据字体颜色
fontsize =10, fontsize_row = 6, fontsize_col = 10, #热图中字体大小、行、列名字体大小
show_rownames = T, show_colnames = T, #表示是否显示行名、列名
main = "Gene标题", #表示热图的标题名字
color = colorRampPalette(c("navy","white","firebrick3"))(100), #表示热图颜色,(100)表示100个等级
angle_col = "45", #表示列标签的角度
gaps_row = NULL, #仅在未进行行聚类时使用,表示在行方向上热图的隔断位置
gaps_col = c(1,2,3,4,5,6), #仅在未进行列聚类时使用,表示在列方向上热图的隔断位置
annotation_row = NA, annotation_col = ann_col, #表示是否对行、列进行注释,默认NA
annotation = NA, annotation_colors = ann_color, #表示行注释及列注释的颜色,默认NA
annotation_legend = TRUE, #表示是否显示注释的图例信息
annotation_names_row = TRUE, annotation_names_col = TRUE) #表示是否显示行、列注释的名称图1 行分组后热图
3.1.2 行信息注释和热图绘制
#行和列注释

ann_col = data.frame(Sample=factor(c(rep("control",3),rep("test",3))))#创建分组列

ann_row = data.frame(pathway=factor(c(rep("pathway1",25),rep("pathway2",15),rep("pathway3",10))))#创建分组行

row.names(ann_col) = colnames(data) #这一行必须有,否则会报错:Error in check.length("fill") :  'gpar' element 'fill' must not be length 0

row.names(ann_row) = rownames(data)

ann_color = list(Sample = c(control="#0089CF", test="#E889BD")) #定义分组颜色
#热图绘制
pheatmap(data, scale = "row", #表示进行均一化的方向,值为 “row”, “column” 或者"none"
cluster_rows = T,cluster_cols = T, #cluster_rows表示仅对行聚类,cluster_cols表示仅对列聚类,值为TRUE或FALSE
cutree_rows = NA, cutree_cols = NA, #若进行了行/列聚类,根据行/列聚类数量分隔热图行,cutree_rows=num分割行,cutree_cols=num分割列
treeheight_row = 30, treeheight_col = 30, #若行、列聚类树高度调整
border_color = "grey60", #表示热图每个小的单元格边框的颜色,默认为 "grey60"
cellwidth = 60, cellheight = 7.5, #表示单个单元格的宽度\高度,默认为 “NA”
display_numbers = F, #表示是否在单元格上显示原始数值或按照特殊条件进行区分标记
fontsize_number = 6, #表示热图上显示数字的字体大小
number_format = "%.2f", #表示热图单元格上显示的数据格式,“%.2f” 表示两位小数,“%.1e”表示科学计数法
number_color = "grey30", #表示热图单元格上显示的数据字体颜色
fontsize =10, fontsize_row = 6, fontsize_col = 10, #热图中字体大小、行、列名字体大小
show_rownames = T, show_colnames = T, #表示是否显示行名、列名
main = "Gene标题", #表示热图的标题名字
color = colorRampPalette(c("navy","white","firebrick3"))(100), #表示热图颜色,(100)表示100个等级
angle_col = "45", #表示列标签的角度
gaps_row = NULL, #仅在未进行行聚类时使用,表示在行方向上热图的隔断位置
gaps_col = c(1,2,3,4,5,6), #仅在未进行列聚类时使用,表示在列方向上热图的隔断位置
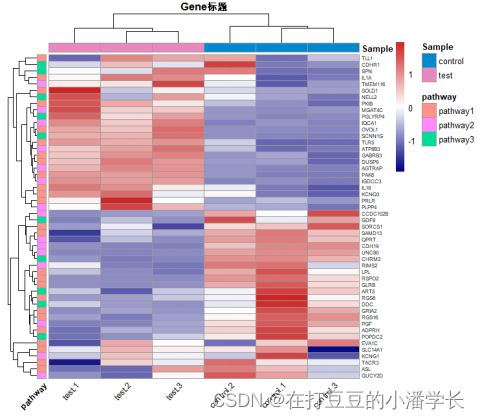
annotation_row = ann_row, annotation_col = ann_col, #表示是否对行、列进行注释,默认NA
annotation = NA, annotation_colors = ann_color, #表示行注释及列注释的颜色,默认NA
annotation_legend = TRUE, #表示是否显示注释的图例信息
annotation_names_row = TRUE, annotation_names_col = TRUE) #表示是否显示行、列注释的名称图2 行和列注释的热图
3.2 多条件分组
#多条件分组行和列注释
ann_col = data.frame(Sample=c(rep("control",3),rep("test",3)), Stage = c(rep("Stage1",1), rep("Stage2",2), rep("Stage3", 3)), time = c(rep("(March",2),rep("July",2),rep("December",2)))#创建分组列
ann_row = data.frame(pathway=c(rep("pathway1",25),rep("pathway2",15),rep("pathway3",10)),Biological_process = c(rep("process1",20), rep("process2", 10),rep("process3", 5),rep("process4", 5),rep("process5", 10) ))#创建分组行
row.names(ann_col) = colnames(data) #这一行必须有,否则会报错:Error in check.length("fill") : 'gpar' element 'fill' must not be length 0
row.names(ann_row) = rownames(data)
ann_color = list(Sample = c(control="#0089CF", test="#E889BD"),Stage=c(Stage1="#FFFFCC",Stage2="#CCFFFF",Stage3="#CCCCFF"),Sex = c(March = "orange", July = "purple", December = "yellow")) #定义分组颜色
#热图绘制

pheatmap(data, scale = "row", #表示进行均一化的方向,值为 “row”, “column” 或者"none"

         cluster_rows = T,cluster_cols = T, #cluster_rows表示仅对行聚类,cluster_cols表示仅对列聚类,值为TRUE或FALSE

         cutree_rows = NA, cutree_cols = NA, #若进行了行/列聚类,根据行/列聚类数量分隔热图行,cutree_rows=num分割行,cutree_cols=num分割列

         treeheight_row = 30, treeheight_col = 30, #若行、列聚类树高度调整

         border_color = "grey60", #表示热图每个小的单元格边框的颜色,默认为 "grey60"

         cellwidth = 60, cellheight = 7.5,  #表示单个单元格的宽度\高度,默认为 “NA”

         display_numbers = F, #表示是否在单元格上显示原始数值或按照特殊条件进行区分标记

         fontsize_number = 6, #表示热图上显示数字的字体大小

         number_format = "%.2f", #表示热图单元格上显示的数据格式,“%.2f” 表示两位小数,“%.1e”表示科学计数法

         number_color = "grey30", #表示热图单元格上显示的数据字体颜色

         fontsize =10, fontsize_row = 6, fontsize_col = 10, #热图中字体大小、行、列名字体大小

         show_rownames = T, show_colnames = T, #表示是否显示行名、列名

         main = "Gene标题", #表示热图的标题名字

         color = colorRampPalette(c("navy","white","firebrick3"))(100), #表示热图颜色,(100)表示100个等级

         angle_col = "45", #表示列标签的角度

         gaps_row = NULL,  #仅在未进行行聚类时使用,表示在行方向上热图的隔断位置

         gaps_col = c(1,2,3,4,5,6),  #仅在未进行列聚类时使用,表示在列方向上热图的隔断位置

         annotation_row = ann_row, annotation_col = ann_col, #表示是否对行、列进行注释,默认NA

         annotation = NA, annotation_colors = ann_color,  #表示行注释及列注释的颜色,默认NA

         annotation_legend = TRUE, #表示是否显示注释的图例信息

annotation_names_row = TRUE, annotation_names_col = TRUE) #表示是否显示行、列注释的名称图3 多条件分组注释的热图
好了本次分享就到这里,下一期将分享根据聚类情况绘制热图的分组。
扫码关注公众号,私聊获得完整代码和演示数据包,以及其他精彩内容


