机器学习:如何快速寻找性能最佳的模型
设想一下您要测试给定数据集是否具有足够的特征来训练机器学习算法,或者在给定数据集上测试不同算法的性能,这两种情况在数据科学领域非常普遍。
通常情况下,要测试特征是否有效,可以训练没有正则化的模型,并验证损失函数是否接近零。
使用哪种算法?
该问题的答案类似于探索性数据分析(EDA)的过程。进行探索性数据分析可以深入了解数据集。同样,有几种方法可以找到最适合该数据集的最佳算法,但这通常需要在循环中迭代多个模型,这可能很耗时。要克服此限制,可以使用lazypredict(Python库)作为选择最佳性能算法的起点。
本文展示了一个示例,该示例分别使用循环迭代和lazypredict来比较分类算法的性能。此外,它还显示了使用lazypredict对波士顿住房数据集(Boston housing)测试不同回归算法的性能。
在iris数据集上比较分类算法
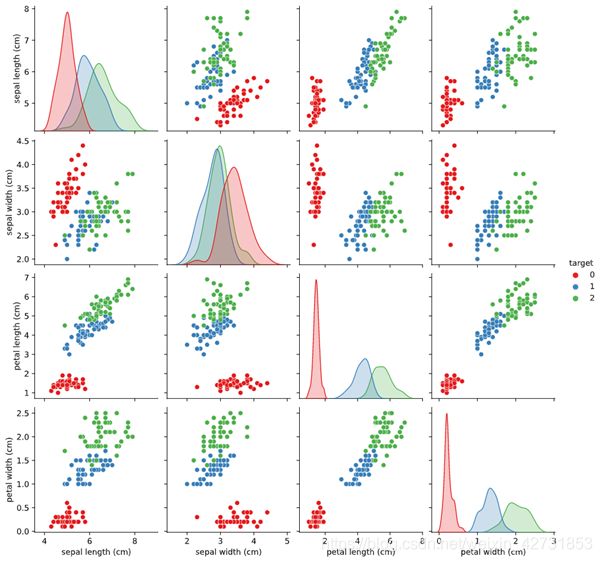
在进行算法比较之前,让我们谈谈数据集。iris数据集由3类(Setosa,Versicolor,Virginica)组成,每种iris植物有50个样本。

这些类别之间的区别特征是萼片长度(sepal length),萼片宽度(sepal width),花瓣长度(petal length)和花瓣宽度(petal width)。下图显示了基于类别的特征之间的关系。
下面的代码显示了数据探索和特征缩放的步骤。
# import libraries
import pandas as pd
import matplotlib.pyplot as plt
from sklearn.model_selection import train_test_split
from sklearn.preprocessing import StandardScaler
from sklearn.metrics import classification_report
import seaborn as sns

import warnings
warnings.filterwarnings('ignore')

# iris dataset
from sklearn.datasets import load_iris
# boston housing price
from sklearn.datasets import load_boston

# load iris
iris = load_iris()

# feature matrix in "X"
X = iris.data

# target in "y"
y = iris.target

# create pandas df
data_iris = pd.DataFrame(X, columns=iris.feature_names)
data_iris['target'] = pd.DataFrame(y.reshape(-1,1), columns=["target"])
data_iris.head(5)

# check the null values
data_iris.isnull().sum()

# pairplot for distribution
sns.pairplot(data_iris ,hue="target", palette='Set1');

# split dataset
X_train, X_test, y_train, y_test = train_test_split(X, y, test_size=0.2, random_state=0)

# scaling features
scalar = StandardScaler()

# fit and transform scalar to train set
X_train_scaled = scalar.fit_transform(X_train)

# transform test set
X_test_scaled = scalar.transform(X_test)
遍历分类模型
首先,让我们从sklearn开始。此案例使用了5个分类模型,分别是逻辑回归,KNN,SVC,随机森林和GaussianNB。

下面的代码显示了测试不同模型的步骤。
# importing 5 models to fit data
from sklearn.linear_model import LogisticRegression
from sklearn.neighbors import KNeighborsClassifier
from sklearn.svm import SVC
from sklearn.ensemble import RandomForestClassifier
from sklearn.naive_bayes import GaussianNB

# create a list
models = [
          ('LogisticRegression', LogisticRegression()),
          ('KNN', KNeighborsClassifier()),
          ('SVC', SVC()),
          ('RF', RandomForestClassifier()),
          ('GNB', GaussianNB())
        ]

results = []
names = []
scoring = ['accuracy', 'precision', 'recall', 'f1', 'roc_auc']
target_name = ['setosa', 'versicolor', 'virginica']
for name, model in models:
        clf = model.fit(X_train_scaled, y_train)
        y_pred = clf.predict(X_test_scaled)
        print(name)
        print(classification_report(y_test, y_pred, target_names=target_name))
下图显示了不同模型的评估指标。

从上面的结果可以得出结论,输入特征足以预测类别,并且所有模型的表现都异常出色(可能存在过拟合的问题)。选择任何2或3个模型进行进一步研究,执行验证技术以检查性能,并在过度拟合的情况下使用正则化技术。
lazypredict
lazypredict提供了一种快速的解决方案,可以比较机器学习算法而无需编写太多代码。下面的代码段显示了如何使用lazypredict。
# import
from lazypredict.Supervised import LazyClassifier
# initialize
clf = LazyClassifier(verbose=0,ignore_warnings=True, custom_metric=None,predictions=True)
# run test
models,predictions = clf.fit(X_train_scaled, X_test_scaled, y_train, y_test)
如果遍历上一节中显示的算法,它将返回每种算法的评估指标。因此,需要额外的代码行才能将其转换为pandas.DataFrame。但是,lazypredict只需几行代码即可完成所有工作。它返回一个pandas.DataFrame,其中包含重要的评估指标和执行算法所需的时间。下图显示了从lazypredict返回的25个分类器中的前5个。

在波士顿住房数据集上比较回归算法
上一节显示了lazypredict如何加速模型探索。本部分显示在波士顿住房数据集上使用lazypredict比较回归算法。数据集包含14个特征和506个观测值。
下面的代码段显示了数据探索和特征缩放的步骤。
# load boston
boston = load_boston()

# feature matrix in "X"
X = boston.data

# target in "y"
y = boston.target

# create pandas df
data_boston = pd.DataFrame(X, columns=boston.feature_names)
data_boston['target'] = pd.DataFrame(y.reshape(-1,1), columns=["target"])
data_boston.head(5)

# check the null values
data_boston.isnull().sum()

# heatmap of correlation matrix
sns.heatmap(data_boston.corr().abs());

# From correlation matrix, we see TAX and RAD are highly correlated features. The columns LSTAT, INDUS, RM, TAX, NOX, PTRAIO has a correlation score above 0.5 with target.
data_boston_new = data_boston[['LSTAT', 'INDUS', 'NOX', 'PTRATIO', 'RM', 'TAX', 'DIS', 'AGE', 'target']]
data_boston_new.head(n=7)
下面的热力图显示了特征之间的相关性。

删除高度相关的特征后,下面的代码片段显示了如何使用lazypredict来比较回归算法。
# import
from lazypredict.Supervised import LazyRegressor

# initialize
reg = LazyRegressor(verbose=0,ignore_warnings=True, custom_metric=None)

# run test
models,predictions = reg.fit(X_train_scaled, X_test_scaled, y_train, y_test)
下图显示了从lazypredict返回的41个回归算法中的前5个。

Lazypredict提供了一种快速的方法,只需几行代码即可比较多种机器学习算法。
来源:Medium
作者:Rahul Pandey
原文:How to find the best performing Machine Learning algorithm
翻译校对:数据黑客