DBSCAN聚类算法的Python可视化
DBSCAN全称为“Density-Based Spatial Clustering of Applications with Noise”。我们可以利用sklearn在python中实现DBSCAN。
首先,import相关的Library。
import numpy as np
import pandas as pd
import math
import matplotlib.pyplot as plt
import matplotlib
from sklearn.cluster import DBSCAN
from sklearn.neighbors import NearestNeighbors
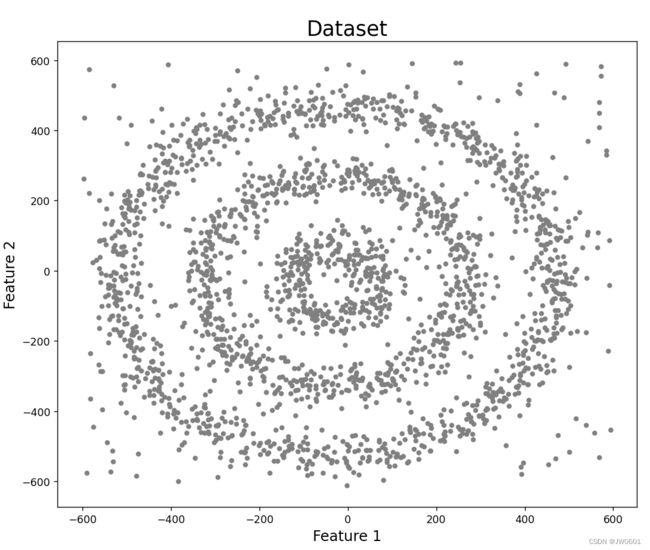
我们首先定义一个function来创建我们需要的数据集,数据集的dimension为2。下图为我们将要创建的数据集的可视化。这个数据集由三个圆圈组成。在我们定义的function中,r代表半径,n代表点的数量。
np.random.seed(42)
def PointsInCircum(r,n=100):
    return [(math.cos(2*math.pi/n*x)*r+np.random.normal(-30,30),math.sin(2*math.pi/n*x)*r+np.random.normal(-30,30)) for x in range(1,n+1)]
我们把创建的三个圆圈数据放在各自的dataframe里面,再制造一个noise数据集用来测试DBSCAN。
df1=pd.DataFrame(PointsInCircum(500,1000))
df2=pd.DataFrame(PointsInCircum(300,700))
df3=pd.DataFrame(PointsInCircum(100,300))
# Adding noise to the dataset
df4=pd.DataFrame([(np.random.randint(-600,600),np.random.randint(-600,600)) for i in range(300)])
将四个dataframe合并成一个dataframe,再进行可视化。
df = pd.concat([df1,df2])
df = pd.concat([df,df3])
df = pd.concat([df,df4])

plt.figure(figsize=(10,10))
plt.scatter(df[0],df[1],s=15,color='grey')
plt.title('Dataset',fontsize=20)
plt.xlabel('Feature 1',fontsize=14)
plt.ylabel('Feature 2',fontsize=14)
plt.show()
接着,我们利用从sklearn中import的DBSCAN。将dataframe输入DBSCAN,然后在原来的dataframe中添加一个column记录DBSCAN输出的labels,并以这些labels作为color map进行可视化。
dbscan=DBSCAN()
dbscan.fit(df[[0,1]])

df['DBSCAN_labels']=dbscan.labels_

# Plotting resulting clusters
plt.figure(figsize=(10,10))
colors=['purple','red','blue','green']
plt.scatter(df[0],df[1],c=df['DBSCAN_labels'],cmap=matplotlib.colors.ListedColormap(colors),s=15)
plt.title('DBSCAN Clustering',fontsize=20)
plt.xlabel('Feature 1',fontsize=14)
plt.ylabel('Feature 2',fontsize=14)
plt.show()
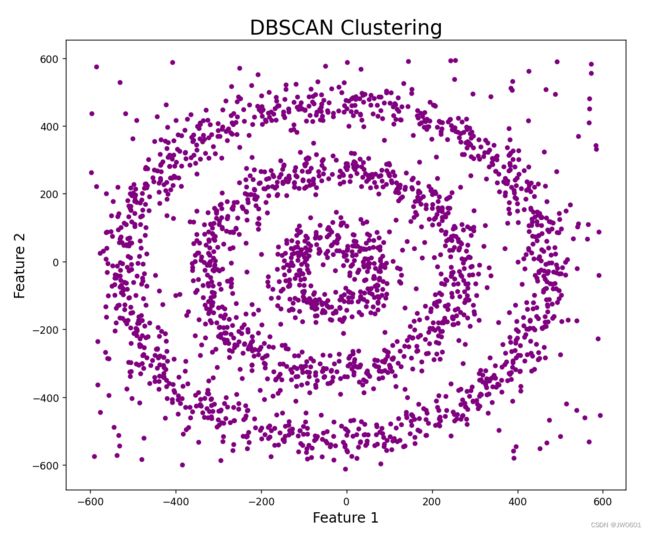
可视化的结果如下图:

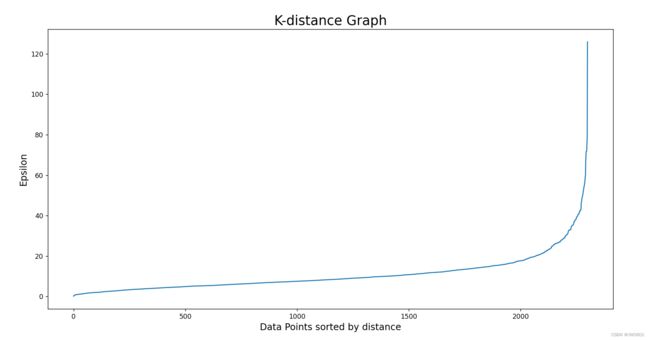
我们看到整个图都是紫色,证明cluster的半径epsilon太小,DBSCAN把所有的点都当成noise了。我们可以利用KNN对epsilon进行优化。
neigh = NearestNeighbors(n_neighbors=2)
nbrs = neigh.fit(df[[0,1]])
distances, indices = nbrs.kneighbors(df[[0,1]])

# Plotting K-distance Graph
distances = np.sort(distances, axis=0)
distances = distances[:,1]
plt.figure(figsize=(20,10))
plt.plot(distances)
plt.title('K-distance Graph',fontsize=20)
plt.xlabel('Data Points sorted by distance',fontsize=14)
plt.ylabel('Epsilon',fontsize=14)
plt.show()

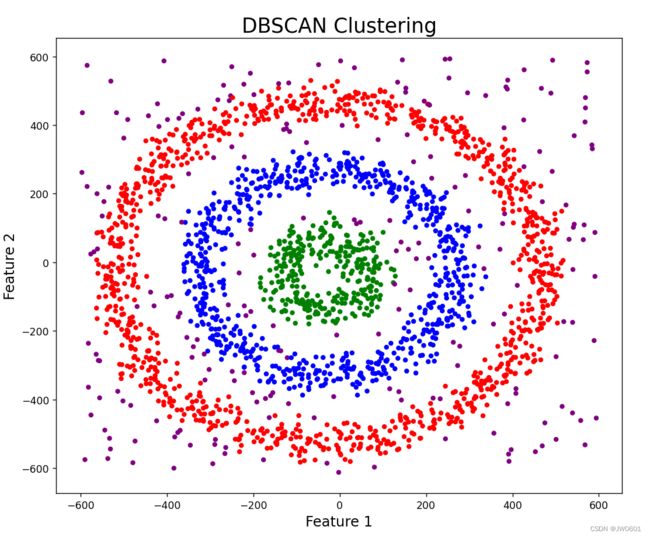
这个图中,曲线斜率最大的位置对应epsilon等于30。重新修改DBSCAN,并把minPoints设定为6。
dbscan_opt=DBSCAN(eps=30,min_samples=6)
dbscan_opt.fit(df[[0,1]])

df['DBSCAN_opt_labels']=dbscan_opt.labels_

# Plotting the resulting clusters
plt.figure(figsize=(10,10))
plt.scatter(df[0],df[1],c=df['DBSCAN_opt_labels'],cmap=matplotlib.colors.ListedColormap(colors),s=15)
plt.title('DBSCAN Clustering',fontsize=20)
plt.xlabel('Feature 1',fontsize=14)
plt.ylabel('Feature 2',fontsize=14)
plt.show()

