机器学习 聚类算法总结
目录
一、聚类算法简述
二、K-Means算法实现案例一——简单实现
三、K-Means算法实现案例二——案例实现
四、K-Means算法实现案例三
五、 轮廓系数
六、CH系数
七、聚类实现图像压缩
八、肘步法
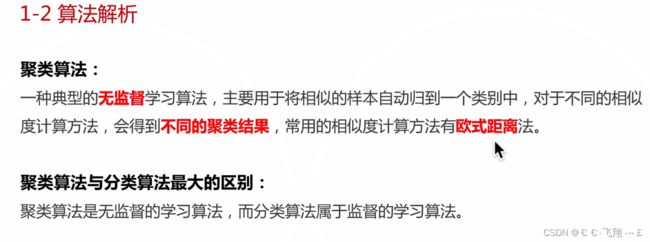
一、聚类算法简述
二、K-Means算法实现案例一——简单实现
# 一、导入库
import numpy as np
import matplotlib.pyplot as plt
from sklearn.cluster import MiniBatchKMeans, KMeans
from sklearn import metrics
from sklearn.datasets._samples_generator import make_blobs


def handler():
    # 二、生成数据集
    x, y = make_blobs(n_samples=1000, n_features=2, centers=[[-1, -1], [0, 0], [1, 1], [2, 2]],
                      cluster_std=[0.4, 0.2, 0.2, 0.2], random_state=9)

    # 生成数据散点图
    plt.scatter(x[:, 0], x[:, 1], marker="o")
    plt.show()

    # 三、可视化
    for index, k in enumerate((2, 3, 4, 5)):
        plt.subplot(2, 2, index + 1)
        y_pred = MiniBatchKMeans(n_clusters=k, batch_size=200, random_state=9).fit_predict(x)
        score = metrics.calinski_harabasz_score(x, y_pred)
        plt.scatter(x[:, 0], x[:, 1], c=y_pred)
        plt.text(.99, .01, ("k=%d,score:%.2f" % (k, score)),
                 transform=plt.gca().transAxes, size=10,
                 horizontalalignment='right')

    # 显示图像
    plt.show()


if __name__ == '__main__':
    handler()
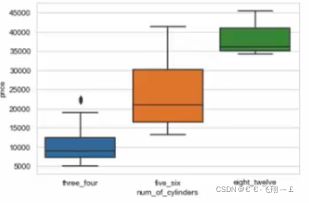
三、K-Means算法实现案例二——案例实现
# 一、导入库
import pandas as pd
import matplotlib.pyplot as plt
import seaborn as sns
import numpy as np
import numpy.random as nr
import math


def handler():
    # 二、观察数据集
    auto_prices = pd.read_csv("Automobile price data _Raw.csv")

    # 三、重新编码名称
    auto_prices.colums = [str.replace('-', "_") for str in auto_prices.columns]

    # 四、处理缺失值
    for col in auto_prices.columns:
        if auto_prices[col].dtype == object:
            count = 0
            count = [count + 1 for x in auto_prices[col] if x == "?"]
            print(col + "" + str(sum(count)))

    auto_prices.drop("normalized_losses", axis=1, inplace=True)
    cols = ["price", "bore", 'stroke', "horsepower", "peak_rpm"]
    for column in cols:
        auto_prices.loc[auto_prices[column] == "?", column] = np.nan
    auto_prices.dropna(axis=0, inplace=True)

    # 五、转换列数据类型
    for column in cols:
        auto_prices[column] = pd.to_numeric(auto_prices[column])

    # 六、特征工程
    cylinder_categories = {"three": "three_four", "four": 'three_four',
                           "five": "five_six", "six": "five_six",
                           "eight": "eight_twelve", "twelve": "eight_twelve"}
    auto_prices['num_of_cylinders'] = [cylinder_categories[x] for x auto_prices['num_of_cylinders']]

    # 七、箱线图
    def plot_box(auto_price, col, col_y="price"):
        sns.set_style("whitegrid")
        sns.boxplot(col, col_y, data=auto_price)
        plt.xlabel(col)
        plt.ylabel(col_y)
        plt.show()

    plot_box(auto_prices, "num_of_cylinders")


if __name__ == '__main__':
    handler()
四、K-Means算法实现案例三
# 一、导入库
import numpy as np
from sklearn.cluster import KMeans
from scipy.spatial.distance import cdist
import matplotlib.pyplot as plt


def handler():
    # 二、生成K值并可视化
    cluster1 = np.random.uniform(0.5, 1.5, (2, 10))
    cluster2 = np.random.uniform(3.5, 4.5, (2, 10))
    X = np.hstack((cluster1, cluster2)).T

    # 遍历k值并可视化
    K = range(1, 10)
    meandistortions = []
    for k in K:
        # 运用KMeans算法
        kmeans = KMeans(n_clusters=k)
        kmeans.fit(X)
        meandistortions.append(sum(np.min(cdist(X, kmeans.cluster_centers_, "euclidean"), axis=1)) / X.shape[0])

    plt.plot(k, meandistortions, 'bx-')
    plt.xlabel("k")
    # 设置平均畸变程度
    plt.ylabel("Ave Distor")
    # 增加表头
    plt.show()


if __name__ == '__main__':
    handler()
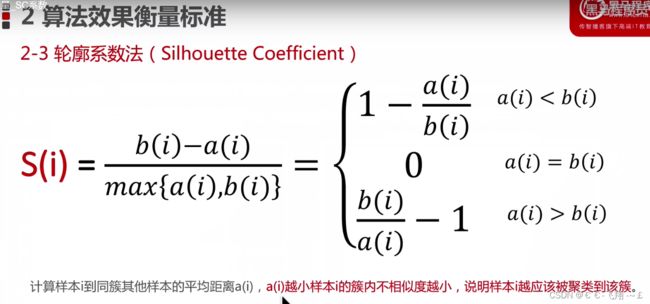
五、 轮廓系数
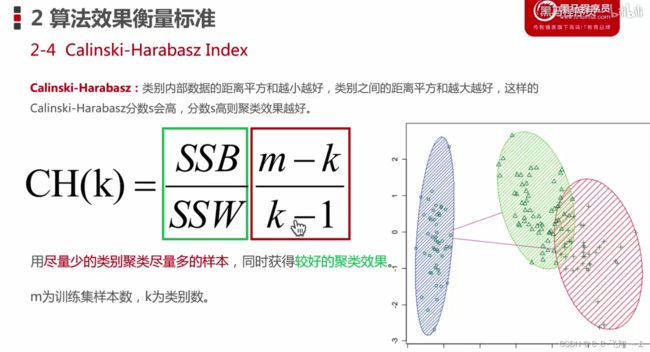
六、CH系数
七、聚类实现图像压缩
# 一、导入库
import numpy as np
import matplotlib.pyplot as plt
from sklearn.cluster import KMeans
from sklearn.metrics import pairwise_distances_argmin
from sklearn.datasets import load_sample_image
from sklearn.utils import shuffle


def handler():
    # 二、导入图片,设定参数
    n_colors = 64
    ball = load_sample_image("ball.jpg")
    ball = np.array(ball, dtype=np.float64) / 255
    w, h, d = original_shape = tuple(ball.shape)
    assert d == 3
    image_array = np.reshape(ball, (w * h, d))
    image_array_sample = shuffle(image_array, random_state=0)[:1000]
    kmeans = KMeans(n_clusters=n_colors, random_state=0).fit(image_array_sample)
    labels = kmeans.predict(image_array)

    # 四、可视化
    plt.figure(1)
    plt.clf()
    ax = plt.axes([0, 0, 1, 1])
    plt.axes("off")
    plt.title("Original image(96, 615 colors)")
    plt.imshow(ball)

    plt.figure(2)
    plt.clf()
    ax = plt.axes([0, 0, 1, 1])
    plt.axes("off")
    plt.title("Quantized image(64 colors, K-Means)")
    plt.imshow(recreate_image(kmeans.cluster_center_, labels, w, h))


# 三、压缩聚类
def recreate_image(codebook, labels, w, h):
    d = codebook.shape[1]
    image = np.zeros((w, h, d))
    label_idx = 0
    for i in range(w):
        for j in range(h):
            image[i][j] = codebook[labels[label_idx]]
            label_idx += 1
    return image


if __name__ == '__main__':
    handler()


