基于SVM(支持向量机)对鸢尾花进行分类
支持向量机方法也是一种强大的机器学习分类方法。
在感知器算法中,我们的目标是最小化分类误差,而在SVM中,我们的优化目标是最大化分类间隔。
较大的分类间隔意味着模型有较小的泛化误差,较小的间隔则意味着模型可能会过拟合。
在SVM中的两条平行的决策边界为:
w 0 + w T x p o s = 1 w_0+\bm{w}^T\bm{x}_{pos}=1 w0+wTxpos=1
w 0 + w T x n e g = − 1 w_0+\bm{w}^T\bm{x}_{neg}=-1 w0+wTxneg=−1
两式相减可得:
w T ( x p o s − x n e g ) = 2 \bm{w}^T(\bm{x}_{pos}-\bm{x}_{neg})=2 wT(xpos−xneg)=2
定义
∣ ∣ w ∣ ∣ = ∑ j = 1 m w j 2 ||\bm{w}||=\sqrt{\sum_{j=1}^{m}w_j^2} ∣∣w∣∣=j=1∑mwj2
可得
w T ( x p o s − x n e g ) ∣ ∣ w ∣ ∣ = 2 ∣ ∣ w ∣ ∣ \frac{\bm{w}^T(\bm{x}_{pos}-\bm{x}_{neg})}{||\bm{w}||}=\frac{2}{||\bm{w}||} ∣∣w∣∣wT(xpos−xneg)=∣∣w∣∣2
等式左侧为正负超平面间的距离,也就是所要最大化的间隔,故需使 2 / ∣ ∣ w ∣ ∣ 2/||\bm{w}|| 2/∣∣w∣∣最大。
SVM的目标函数记为:
w 0 + w T x i ≥ 1 , if y ( i ) = 1 w_0+\bm{w}^T\bm{x}^{i}\ge1, \text{if} \ y^{(i)}=1 w0+wTxi≥1,if y(i)=1
w 0 + w T x i ≤ 1 , if y ( i ) = − 1 w_0+\bm{w}^T\bm{x}^{i}\le1, \text{if} \ y^{(i)}=-1 w0+wTxi≤1,if y(i)=−1
对于非线性可分的数据,需要放松线性约束条件,以保证在适当的罚项成本下,对错误的分类情况优化时能够收敛。
w 0 + w T x i ≥ 1 , if y i = 1 − ξ ( i ) w_0+\bm{w}^T\bm{x}^{i}\ge1, \text{if} \ y^{i}=1-\xi^{(i)} w0+wTxi≥1,if yi=1−ξ(i)
w 0 + w T x i ≤ 1 , if y i = − 1 + ξ ( i ) w_0+\bm{w}^T\bm{x}^{i}\le1, \text{if} \ y^{i}=-1+\xi^{(i)} w0+wTxi≤1,if yi=−1+ξ(i)
通过引入 C C C值,新的目标优化为使下式最小:
1 2 ∣ ∣ w ∣ ∣ 2 + C ( ∑ i ξ ( i ) ) \frac{1}{2}||\bm{w}||^2+C(\sum_i\xi^{(i)}) 21∣∣w∣∣2+C(i∑ξ(i))
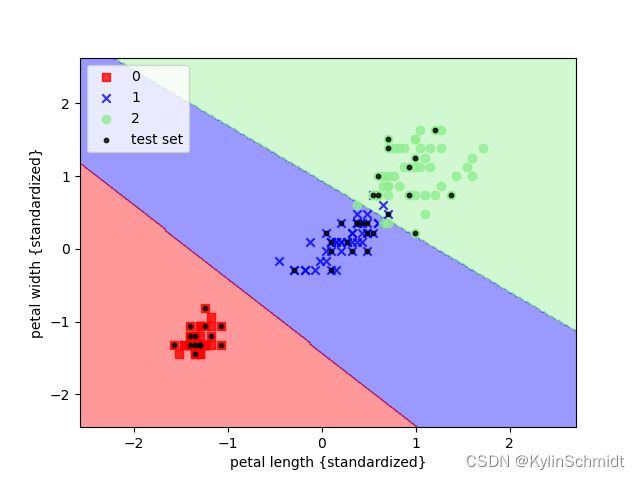
通过这种方法我们也可以对鸢尾花进行分类,代码引自《python机器学习》
from sklearn import datasets
from sklearn.model_selection import train_test_split
from sklearn.preprocessing import StandardScaler
from sklearn.svm import SVC
from matplotlib.colors import ListedColormap
import matplotlib.pyplot as plt
import numpy as np
iris = datasets.load_iris()
X = iris.data[:, [2, 3]]
y = iris.target
X_train, X_test, y_train, y_test = train_test_split(X,y,test_size=0.3,random_state=0)

sc = StandardScaler()
sc.fit(X_train)
X_train_std = sc.transform(X_train)
X_test_std: object = sc.transform(X_test)


def plot_decision_regions(X, y, classifier, test_idx=None, resolution=0.02):
    # 设置marker generator和color map
    markers = ('s', 'x', 'o', '^', 'v')
    colors = ('red', 'blue', 'lightgreen', 'gray', 'cyan')
    cmap = ListedColormap(colors[:len(np.unique(y))])
    x1_min, x1_max = X[:, 0].min() - 1, X[:, 0].max() + 1
    x2_min, x2_max = X[:, 1].min() - 1, X[:, 1].max() + 1
    xx1, xx2 = np.meshgrid(np.arange(x1_min, x1_max, resolution),
                           np.arange(x2_min, x2_max, resolution))
    Z = classifier.predict(np.array([xx1.ravel(), xx2.ravel()]).T)
    Z = Z.reshape(xx1.shape)
    plt.contourf(xx1, xx2, Z, alpha=0.4, cmap=cmap)
    plt.xlim(xx1.min(), xx1.max())
    plt.ylim = (xx2.min(), xx2.max())
    X_test, y_test = X[test_idx, :], y[test_idx]
    for idx, cl in enumerate(np.unique(y)):  # np.unique:去除重复数据
        plt.scatter(x=X[y == cl, 0], y=X[y == cl, 1], alpha=0.8, c=cmap(idx), marker=markers[idx], label=cl)
    if test_idx:
        X_test, y_test = X[test_idx, :], y[test_idx]
        plt.scatter(X_test[:, 0], X_test[:, 1], c='black', alpha=0.8, linewidths=1, marker='o', s=10, label='test set')


X_combined_std = np.vstack((X_train_std, X_test_std))
y_combined = np.hstack((y_train, y_test))
svm = SVC(kernel='linear', C=1.0, random_state=0)# 使用线性核函数,设置C值为1
svm.fit(X_train_std, y_train)
plot_decision_regions(X_combined_std, y_combined, classifier=svm, test_idx=range(105,150))
plt.xlabel('petal length {standardized}')
plt.ylabel('petal width {standardized}')
plt.legend(loc='upper left')
plt.show()
