"""
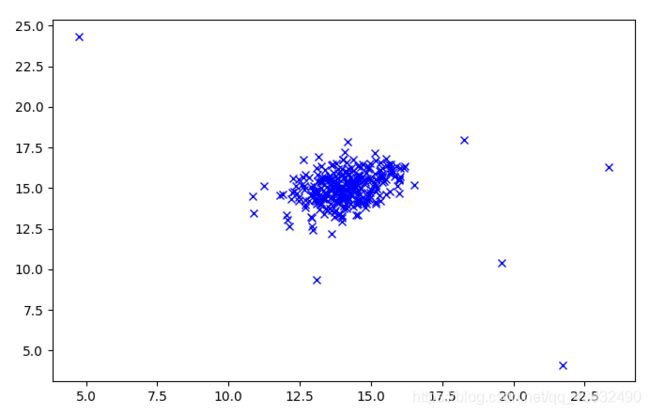
这部分,您将实现一个异常检测算法来检测服务器计算机中的异常行为。
他的特征是测量每个服务器的响应速度(mb/s)和延迟(ms)。
当你的服务器运行时,你收集到了m=307的样本,是无标签的。
你相信其中绝大多数样本是正常的,但还是有一小部分的样本是异常的。
我们将使用高斯分布模型来检测数据集中的异常样本。
"""
import pandas as pd
import numpy as np
from scipy.io import loadmat
import matplotlib.pyplot as plt
mat = loadmat('data/ex8data1.mat')
print(mat.keys())
X = mat['X']
Xval, yval = mat['Xval'], mat['yval']
print(X.shape, Xval.shape, yval.shape)
def plot_data():
plt.figure(figsize=(8, 5))
plt.plot(X[:, 0], X[:, 1], 'bx')
plot_data()
plt.show()
多变量高斯分布:
def gaussian(X, mu, sigma2):
'''
计算高斯分布概率
Args:
X: 训练集
mu:平均值矩阵
sigma2:方差
Returns:
一个(m, )向量,包含每个样本的概率值
'''
m, n = X.shape
if np.ndim(sigma2) == 1:
sigma2 = np.diag(sigma2)
norm = 1. / (np.power((2 * np.pi), n / 2) * np.sqrt(np.linalg.det(sigma2)))
exp = np.zeros((m, 1))
for row in range(m):
xrow = X[row]
exp[row] = np.exp(
-0.5 * ((xrow - mu).T).dot(np.linalg.inv(sigma2)).dot(xrow - mu))
return norm * exp
def getGaussianParams(X, useMultivariate):
'''
计算均值与方差
Args:
X: 训练集
useMultivariate:是否使用多元高斯分布
Returns:
均值(mu),方差(sigma2)
'''
mu = X.mean(axis=0)
if useMultivariate:
sigma2 = ((X - mu).T @ (X - mu)) / len(X)
else:
sigma2 = X.var(axis=0, ddof=0)
return mu, sigma2
def plotContours(mu, sigma2):
'''
画出高斯概率分布的图,在三维中是一个上凸的曲面。投影到平面上则是一圈圈的等高线。
Args:
mu:平均值
sigma2:方差
'''
delta = .3
x = np.arange(0, 30, delta)
y = np.arange(0, 30, delta)
xx, yy = np.meshgrid(x, y)
points = np.c_[xx.ravel(), yy.ravel()]
z = gaussian(points, mu, sigma2)
z = z.reshape(xx.shape)
cont_levels = [10 ** h for h in range(-20, 0, 3)]
'''
cont_levels : [1e-20, 1e-17, 1e-14, 1e-11, 1e-08, 1e-05, 0.01]
'''
plt.contour(xx, yy, z, cont_levels)
plt.title('Gaussian Contours', fontsize=16)
plot_data()
useMV = False
plotContours(*getGaussianParams(X, useMV))
plot_data()
useMV = True
plotContours(*getGaussianParams(X, useMV))
plt.show()
'''
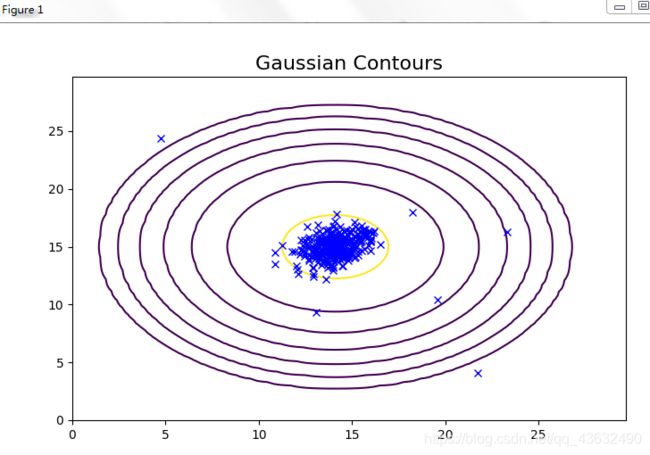
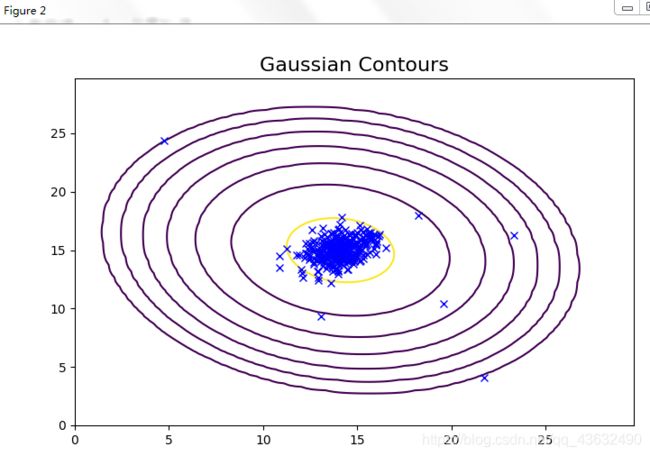
从上面的图可以看到,一元高斯模型仅在横向和纵向上有变化,
而多元高斯模型在斜轴上也有相关变化,对应着特征间的相关关系。
而一元高斯模型就是多元高斯模型中协方差矩阵为对角矩阵的结果,即协方差都为0,不考虑协方差,只考虑方差,故一元高斯模型不会有斜轴上的变化。
从上面的图我们可以清晰的看到,哪些样本的概率高,哪些样本的概率低,概率低的样本很大程度上就是异常值。
'''

def selectThreshold(yval, pval):
'''
选择最佳的阈值
Args:
yval:验证集样本结果
pval:模型预测结果
Returns:
最佳的F1值:bestF1,最佳的阈值:bestEpsilon
'''
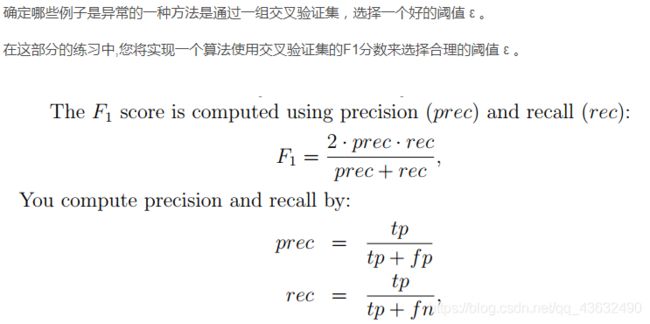
def computeF1(yval, pval):
'''
计算F1值
Args:
yval:验证集样本结果
pval:模型预测结果
Returns:
F1值
'''
m = len(yval)
tp = float(len([i for i in range(m) if pval[i] and yval[i]]))
fp = float(len([i for i in range(m) if pval[i] and not yval[i]]))
fn = float(len([i for i in range(m) if not pval[i] and yval[i]]))
prec = tp / (tp + fp) if (tp + fp) else 0
rec = tp / (tp + fn) if (tp + fn) else 0
F1 = 2 * prec * rec / (prec + rec) if (prec + rec) else 0
return F1
epsilons = np.linspace(min(pval), max(pval), 1000)
bestF1, bestEpsilon = 0, 0
for e in epsilons:
pval_ = pval < e
thisF1 = computeF1(yval, pval_)
if thisF1 > bestF1:
bestF1 = thisF1
bestEpsilon = e
return bestF1, bestEpsilon
mu, sigma2 = getGaussianParams(X, useMultivariate=True)
pval = gaussian(Xval, mu, sigma2)
bestF1, bestEpsilon = selectThreshold(yval, pval)
print(bestF1, bestEpsilon)
y = gaussian(X, mu, sigma2)
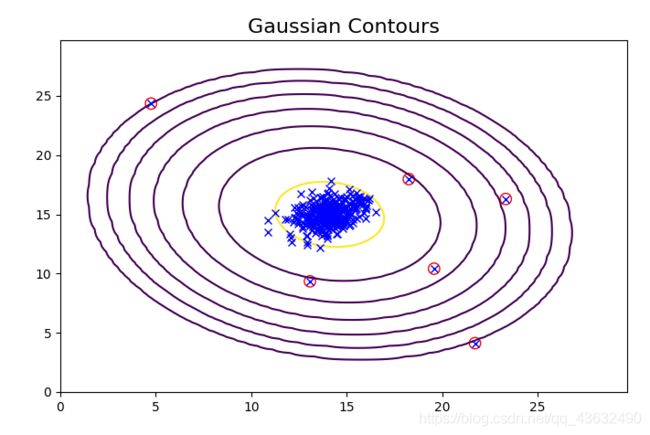
xx = np.array([X[i] for i in range(len(y)) if y[i] < bestEpsilon])
print(xx.shape)
plot_data()
plotContours(mu, sigma2)
plt.scatter(xx[:, 0], xx[:, 1], s=80, facecolors='none', edgecolors='r')
plt.show()
mat = loadmat('data/ex8data2.mat')
print(mat.keys())
X2 = mat['X']
Xval2, yval2 = mat['Xval'], mat['yval']
print(X2.shape, Xval2.shape, yval2.shape)
mu, sigma2 = getGaussianParams(X2, useMultivariate=True)
ypred = gaussian(X2, mu, sigma2)
yval2pred = gaussian(Xval2, mu, sigma2)
bestF1, bestEpsilon = selectThreshold(yval2, yval2pred)
anoms = np.array([X2[i] for i in range(len(ypred)) if ypred[i] < bestEpsilon])
print(bestEpsilon, anoms.shape)


