matplotlib(三大图表 折线plot 饼状 柱状bar)
matplotlib
三大图表 折线plot 饼状 柱状bar
-
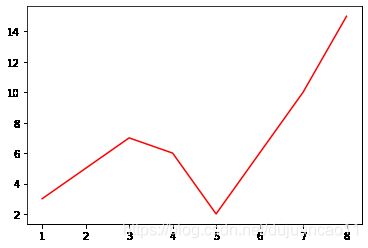
绘制折线图
import numpy as np
import matplotlib.pyplot as plt #绘图
x = np.array([1,2,3,4,5,6,7,8]) #创建X轴
y = np.array([3,5,7,6,2,6,10,15]) #创建Y轴
plt.plot(x,y,'r')# 绘制折线图方法 参数1 x 参数2 y 参数3 color(r)红色
-
结果
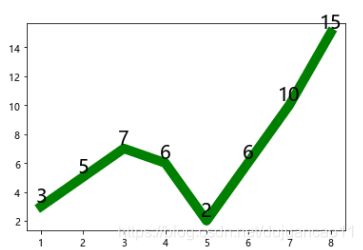
import numpy as np
import matplotlib.pyplot as plt #绘图
x = np.array([1,2,3,4,5,6,7,8]) #创建X轴
y = np.array([3,5,7,6,2,6,10,15]) #创建Y轴
#显示数字
for a, b in zip(x, y):
    plt.text(a, b, b, ha='center', va='bottom', fontsize=20)
#plt.plot(x,y,'r')# 绘制折线图方法 参数1 x 参数2 y 参数3 color(r)红色
plt.plot(x,y,'g',lw=10)# 参数4 line 线宽w
比较详细的参考文章:https://www.douban.com/note/722929210/
-
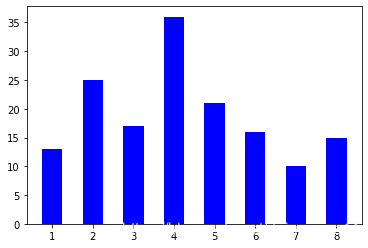
绘制柱状图
import numpy as np
import matplotlib.pyplot as plt #绘图
# 三大图表 折线plot 饼状 柱状bar
x = np.array([1,2,3,4,5,6,7,8])
y = np.array([13,25,17,36,21,16,10,15])
plt.bar(x,y,0.5,alpha=1,color='b')#  参数3 宽度  参数4 透明度 3 0.9  参数5 color (b蓝色)
plt.show()
-
结果
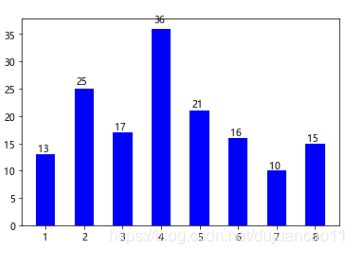
import numpy as np
import matplotlib.pyplot as plt #绘图
# 显示高度
def autolabel(rects):
    for rect in rects:
        height = rect.get_height()
        plt.text(rect.get_x()+rect.get_width()/2.- 0.2, 1.03*height, '%s' % int(height))
# 三大图表 折线plot 饼状 柱状bar
x = np.array([1,2,3,4,5,6,7,8])
y = np.array([13,25,17,36,21,16,10,15])
autolabel(plt.bar(x,y,0.5,alpha=1,color='b' ))
#plt.bar(x,y,0.5,alpha=1,color='b' )#  参数3 宽度  参数4 透明度 3 0.9  参数5 color (b蓝色)
plt.show()
autolabel(plt.bar(x,y,0.5,alpha=1,color='rgb' ))
参考博客:
https://blog.csdn.net/ronaldo4511/article/details/79923102
https://www.cnblogs.com/zhhfan/p/9971757.html
https://www.cnblogs.com/HuZihu/p/9390971.html
-
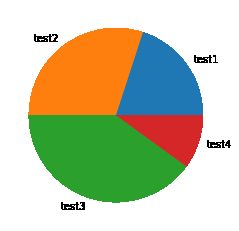
普通饼状体
from matplotlib import pyplot as plt
# 显示饼状图
label = ["test1","test2","test3","test4"]
fracs = [20,30,40,10]
plt.axes(aspect=2)
plt.pie(labels=label,x=fracs)
plt.show()
-
结果
还有很多种画法
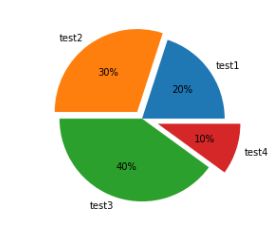
显示每个label的比例
plt.pie(labels=label,x=fracs,autopct="%.0f%%") #增加第三个参数显示每个label的比例
plt.show()
可以让某个/某几个label离开圆柱体,可以设置距离,如果不离开,距离设置为0即可
# 可以让某个标签离开圆柱体
explode = [0,0.1,0,0.2] # 这里的0.1和0.2就是离开的距离
plt.pie(labels=label,x=fracs,autopct="%.0f%%",explode=explode)#增加第四个参数
设置阴影效果
#shadow设置阴影效果
plt.pie(labels=label,x=fracs,autopct="%.0f%%",explode=explode,shadow=True)#增加第五个参数
参考博客:
https://www.cnblogs.com/bainianminguo/p/11014198.html
源程序版本matplotlib2.1.1
本机:matplotlib3.1.1
程序正常运行,先试一试,不行再重新安装
