深入分析泰坦尼克号分析生存率
目录
背景
目标
数据字典
1.获取数据
2.探索数据
2.1.基本信息查看(Head, info)
2.2.数据清洗
2.3.数据探索及数据解释
3.数据建模
4.数据分析
5.总结
背景
- 泰坦尼克号:英国白星航运公司下辖的一艘奥林匹克级邮轮,于1909年3月31日在爱尔兰贝尔法斯特港的哈兰德与沃尔夫造船厂动工建造,1911年5月31日下水,1912年4月2日完工试航。
- 首航时间:1912年4月10日
- 航线:从英国南安普敦出发,途经法国瑟堡-奥克特维尔以及爱尔兰昆士敦,驶向美国纽约。
- 沉船:1912年4月15日(1912年4月14日23时40分左右撞击冰山)
- 船员+乘客人数:2224
- 遇难人数:1502(67.5%)
目标
建立决策树模型,按照乘客的特征预测该乘客是否会在此次事故中死亡。
数据字典
| Survived | Definition | Details | Sex | Definition | Details |
| 死亡 | 0 | NA | 男 | 0 | <= 0.5 |
| 生还 | 1 | NA | 女 | 1 | <= 1 |
| Pclass | Embarked | ||||
| 一等位 | 1 | <= 1.5 | Cherbourg | 0 | <= 0.5 |
| 二等位 | 2 | <= 2.5 | Queenstown | 1 | <= 1 |
| 三等位 | 3 | <= 3 | Southampton | 2 | <= 2 |
为了更方便后续建立决策树模型,数据会转换成数字的形式。大纲可参考上表。以下会详细解释相关的数据。
- PassengerId 乘客id
- 不存在很大的相关性,因此会进行删除。
- Survived 是否获救
- 0=没有获救,1=有获救
- 获救:38.25%
- 遇难:61.75%(实际遇难比例:67.5%)
- Pclass 船票级别
- 代表社会经济地位。 1: 一等座位(),2 : 二等座位,3 :三等座位
- 人数占比是一等座位(24.07%),二等座位(20.70%),三等座位(55.23%)
- Sex 性别
- male 男 =0,female 女 =1
- 男 : 女 = 64.9% : 35.1%
- Age 年龄(缺少20%数据)
- 幼儿(5.29%)
- 儿童(2.47%)
- 少年(12.37%)
- 青年(61.64%)
- 中年(15.41%)
- 老年(2.81%)
- 一般来说:0(初生)-6岁为婴幼儿;7-12岁为少儿;13-17岁为青少年;18-45岁为青年;46-69岁为中年;>69岁为老年。
- SibSp 同行的兄弟姐妹或配偶总数
- 68%无,23%有1个 … 最多8个
- Parch 同行的父母或孩子总数
- 76%无,13%有1个,9%有2个 … 最多6个
- Some children travelled only with a nanny, therefore parch=0 for them.
- Ticket 票号(格式不统一)
- 示例:A/5 21171
- 示例:STON/O2. 3101282
- Fare 票价
- Embarked 登船港口
- C = Cherbourg(瑟堡)19%, Q = Queenstown(皇后镇)9%, S = Southampton(南安普敦)72%
衍生字段(部分,在后续代码中补充)
- categories
- 以年龄进行划分
1.获取数据
from sklearn import tree
import pandas as pd
from sklearn.tree import DecisionTreeClassifier
from sklearn.model_selection import train_test_split
from sklearn.model_selection import GridSearchCV
from sklearn.model_selection import cross_val_score
import matplotlib.pyplot as plt
import numpy as np
import graphviz
import seaborn as sns

"""读取数据及观察数据"""
data = pd.read_csv("C:\\Users\\DA21\\Eric_TDAS\\train.csv")
2.探索数据
2.1.基本信息查看(Head, info)
data.head()data.info()从上表中可以看到,因为PassengerID 和 Name, Ticket,Cabin等不太重要。且Cabin的缺失值严重,所以在2.2.会进行删除的操作
2.2.数据清洗
#将没有用的columns 删除
data.drop(["PassengerId","Name","Ticket","Cabin"],inplace = True, axis = 1)
#Age的列存在缺失值,因此要将缺失值进行填补。
data["Age"] = data["Age"].fillna(data["Age"].mean())#看看Embarked的列有多少个值。然后并将其转换成list,以便后续将其转换成数字
label_1 = data["Embarked"].unique().tolist()
label_1#将数据转换成 0 1 2 的形式
data["Embarked"] = data["Embarked"].apply(lambda x : label_1.index(x))#看看Sez有多少个值,并在后续转换成数值
label_2 = data["Sex"].unique().tolist()
label_2#将数值转换成 0 1 的形式,方便后续建模使用
data["Sex"] = data["Sex"].apply(lambda x : label_2.index(x))2.3.数据探索及数据解释
#将年龄进行分类。方便数据探索
data["Survived"].replace(0, "死",inplace =True)
data["Survived"].replace(1, "生",inplace =True)
data["Pclass"].replace(1, "一等位",inplace =True)
data["Pclass"].replace(2, "二等位",inplace =True)
data["Pclass"].replace(3, "三等位",inplace =True)
data["Sex"].replace(0, "男",inplace =True)
data["Sex"].replace(1, "女",inplace =True)
data
import matplotlib as mpl
mpl.rcParams['font.family']='DFKai-SB' # 修改了全局变量
plt.style.use('grayscale')
s_pclass= data['Survived'].groupby(data['Pclass'])
s_pclass = s_pclass.value_counts().unstack()
# s_pclass = data.groupby(data['Survived'])['Pclass'].count()
s_pclass
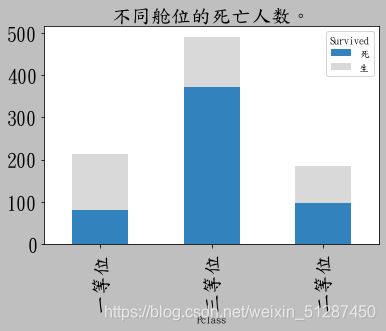
fig = s_pclass.plot(kind='bar',stacked = True, colormap='tab20c',title='不同舱位的死亡人数。',fontsize=20)
fig.axes.title.set_size(20)数据解释:三等位的死亡人数为最高,约490人,且死亡比例为78%。而一等位的死亡人数最低,约90人,且死亡比例为45%。其中二等位的死亡人数,约100人,死亡比例约50%。
s_sex = data['Survived'].groupby(data['Sex'])
s_sex = s_sex.value_counts().unstack()
# s_sex = s_sex[[1.0,0.0]]
fig = s_sex.plot(kind='bar',stacked = True, colormap='tab20c',title='男女的死亡率。',fontsize=20)
数据解释:女性的死亡人数最低,约为80人,死亡比率为27%。而男性的死亡人数及死亡比率较高,分别为460及92%。
#将年龄进行分类。
bins = [0,6, 12, 20,39,59,100]
group_names = ['幼儿', '儿童', '少年',"青年","中年","老年"]
data['categories'] = pd.cut(data['Age'], bins, labels = group_names)
data
mpl.rcParams['font.family']='DFKai-SB' # 修改了全局变量
plt.style.use('grayscale')
s_pclass= data['Survived'].groupby(data['categories'])
s_pclass = s_pclass.value_counts().unstack()
fig = s_pclass.plot(kind='bar',stacked = True, colormap='tab20c',title='不同年龄的死亡率。',fontsize=20)
fig.axes.title.set_size(20)数据解释:青年,少男及中年分类的人死亡率约为50 - 60%,属于死亡人数最高的类别。最高死亡率的分类是 儿童及老年分类的死亡比率约84%。反之,死亡率最低的是幼儿类,约17%。
plt.style.use('grayscale')
x = data["Survived"].value_counts()
fig = x.plot.pie(figsize=(8, 8),autopct='%.2f',colormap='tab20c',title='死亡比率。',fontsize=20)
fig.axes.title.set_size(25)数据解释:整体死亡率超过60%,属于较高水平。
plt.style.use('grayscale')
x = data["Pclass"].value_counts()
fig = x.plot.pie(figsize=(8, 8),autopct='%.2f',colormap='tab20c', title='舱位等级的人数分配',fontsize=20)
fig.axes.title.set_size(25)数据解释:三等位的人数占比最高,约55.23%,最低是二等位,约20.7%
plt.style.use('grayscale')
x = data["Sex"].value_counts()
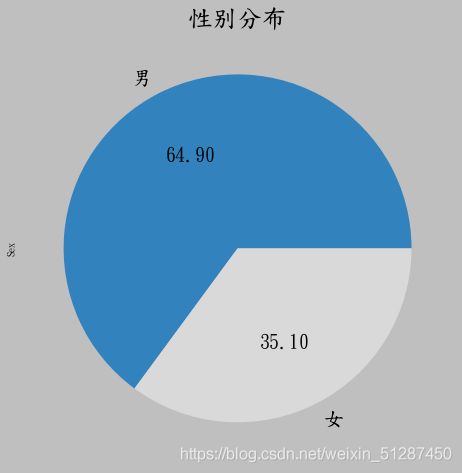
fig = x.plot.pie(figsize=(8, 8),autopct='%.2f',colormap='tab20c', title='性别分布',fontsize=20)
fig.axes.title.set_size(25)
、
数据解释:乘客主要以男性为主,约64.9%。 男女人数相差约为两倍。
plt.style.use('grayscale')
x = data["categories"].value_counts()
fig = x.plot.pie(figsize=(8, 8),autopct='%.2f',colormap='tab20c', title='性别分布',fontsize=20)
fig.axes.title.set_size(25)数据解释:年龄分布主要集中在青年阶段,为61.64%。第二大群体占比是 中年及少年群体,约为30%。最后占比最低的是儿童类别,约为2.47%。最高类别和最低类别相差约30倍
plt.figure(figsize=(20,15))
sns.heatmap(data.corr(),annot=True)数据解释:从上表中可见,最高的正相关是 sex 与 survived,约0.54,属于中度相关性。在性别(sex)数据中,0 代表男性,1代表女性。 也就是说,女性生存的几率比较高。 其次是,Fare与 survived,约为0.25,属于弱相关系数,说明票价约高与生存率有一定的关系。而 Pclass 与 Survived,属于负相关,约,-0.34。 属于弱相关系数。在座舱(Pclass)数据中,1代表一等座,2 代表二等座,3代表三等座。 这说明,数值越大,存活率越低。换句话说,三等座的死亡人数较高,这也符合逻辑推理。
总结2.2数据探索及数据解释部分,并提出相关问题。
问题1:为什么女性的生存率比男性较高?
从文化层面而言,英国较为重视绅士文化,从而令女性在此次事故中有较低的死亡率(27%)。
众所周知,英国绅士文化起源于古希腊和古代罗马。古希腊人为世界留下了丰富的文化遗产,是西方文明的摇篮文化。在希腊时期,有美德的贵族被称为绅士。他们认为绅士应该具备高尚的品质,如智慧、正义、勇气、宽容和好心。古罗马文明是古希腊文化的忠实学生,他继承了古希腊文化的余辉,他们追求民族特色,德性美德,国家忠贞,勇于牺牲的爱国主义和爱国精神,讲求严明的纪律,讲究秩序和法治观念,威严、庄重,这些都是罗马时代绅士最重要的品质。就是这种根深蒂固的文化精神,从而培养了他们十分尊重及保护女士的核心价值观。当他们在面对这次事故,他们会优先的将生存的位置留给了女性。这也是为什么, Survived 和 Sex 之前有0.54的中度正相关性。这意味着,当你是女性的时候,生存率便会更高。在男女死亡率中,男性高死亡率(73%)的数据也印证了这一观点。
问题2:为什么舱位的等级较低的生存率较低?
从船体结构而言,救生艇甲板主要集中在最上层,间接导致了第三舱位的死亡人数较高。
船体的进水位置主要是经最底部渗透进来,而这个位置恰好便是第三舱位。这大大的缩减了他们可逃亡的时间。因为他们需要跑到救生艇甲板,乘坐救生艇离开。此外,救生艇的数量大大不足,数量只能够一半的人使用。所以当第三舱位的人历尽辛苦跑到了顶层,可能也会因为缺少救生艇而无法获救。就算他们选择跳船,在极冷的天气下,他们也很难活到最后。这也就是为什么数据中指出,第三舱位的死亡率最高,约78%。 而在相关系数表中,生存(Survived )和舱位(Pclass)之前存在负弱相关系数。这说明,舱位等级的数值越高(在数据中,高数值代表舱位等级较低),则生存率越低。此外,生存(Survived )和船票(Fare)之前存在弱相关性,这说明生存率越高,则船票越高。
3.建模
Part A:决策树
1.1 决策树建模
#进行建模,用X的特征预测Y的值
x = data[["Pclass","Sex","Age","SibSp","Fare","Embarked"]]
y = data["Survived"]
#用train_test_split的方法拆分数据集
x_train,x_test,y_train,y_test = train_test_split(x,y,test_size = 0.2)#因为拆分后的train 和 test数据集的index会混乱,所以将数据集的index 进行重新排序
for i in [x_train, x_test, y_train, y_test]:
i.index = range(i.shape[0])#建立模型,并 fit 模型
clf = DecisionTreeClassifier(random_state = 0)
clf.fit(x_train,y_train)#看看,train test split 的模型分数是多少。
score_1 = clf.score(x_test,y_test)
score_1#用交叉验证,看看模型的分数
score_2 = cross_val_score(clf,x,y, cv = 10).mean()
score_2两者的分数差异并不大,因此是属于可以接受的阶段
1.2 决策树简单调参
#看看train test split 和 cross validation (交叉验证)是否出现差异很大的情况
#并希望看看有没有过拟合的情况,以及找出最优的分数
tr = []
td = []

for i in range(10):
    clf = DecisionTreeClassifier(random_state=(25), max_depth=(i +1),criterion="entropy",min_samples_leaf =16)
    clf.fit(x_train,y_train)

    score_tr = clf.score(x_train,y_train)
    score_td = cross_val_score(clf, x,y,cv =10).mean()

    tr.append(score_tr)
    td.append(score_td)
print(max(td))
plt.plot(range(1,11),tr, color = "red",label ="train")
plt.plot(range(1,11),td, color = "blue",label ="test")
plt.legend()
plt.show()
根据上图可见,在没有过拟合的情况下, max_depth在等于3的时候是模型有效度最高的时候。因此接下来调节参数,在max_depth传入3的参数
1.3 决策树网格搜索调参
3.3.1 网格搜索 - 所有参数
#利用网格搜索相关参数,找出最优的参数。
gini_thresholds = np.linspace(0,0.5,20)
parameters = {'splitter':('best','random')
                ,'criterion':("gini","entropy")
                ,"max_depth":[*range(1,10)]
                ,'min_samples_leaf':[*range(1,50,5)]
                ,'min_impurity_decrease':[*np.linspace(0,0.5,20)]
}
clf = DecisionTreeClassifier(random_state=25)
GS = GridSearchCV(clf, parameters, cv=10)
GS.fit(x_train,y_train)
X = GS.best_params_
Y = GS.best_score_
print("best_params_:%s best_score_:%s " % (X,Y))
将上面的参数输入在下表中,得到了模型的参数
#把上面得到的参数,输入在模型中
clf_best =tree.DecisionTreeClassifier(random_state=25
                                 ,criterion = "gini"
                                 , max_depth = 3
                                 , min_impurity_decrease= 0.0
                                 , min_samples_leaf =  1
                                 , splitter = "best"
                                 )
clf_best.fit(x_train, y_train)
clf_socre = clf_best.score(x_train, y_train)
找出最优的参数,但是这是在设计5个参数下调节 出来的最优参数。但我们仍然需要一个个的调节参数,是否会存在更高的分数。
1.3.2 网格搜索 - 一个个参数进行
#min_samples_leaf的最优参数测试。结果比全部参数搜索的0.8360128617363344要低,因此不选择这个参数
parameters = {'min_samples_leaf':[*range(1,50,5)]
}
clf = DecisionTreeClassifier(random_state=25, max_depth = 3)
GS = GridSearchCV(clf, parameters, cv=10)
GS.fit(x_train,y_train)
X = GS.best_params_
Y = GS.best_score_
print("best_params_:%s best_score_:%s " % (X,Y)) ![]()
这个分数比全部参数调参的0.8360128还要低,所以这个参数无需调整
#min_samples_leaf的最优参数测试。结果比全部参数搜索的0.8360128617363344要低,因此不选择这个参数
parameters = {'min_samples_leaf':[*range(1,50,5)]
}
clf = DecisionTreeClassifier(random_state=25, max_depth = 3)
GS = GridSearchCV(clf, parameters, cv=10)
GS.fit(x_train,y_train)
X = GS.best_params_
Y = GS.best_score_
print("best_params_:%s best_score_:%s " % (X,Y))
这个分数比全部参数调参的0.8360128还要低,所以这个参数无需调整
#k看x 的值排列如何,以便后续决策树可视化敲定feature name的时候用
x.columns ![]()
#min_impurity_decrease的分数和min_samples_leaf的分数一样,且低于原本的。所以并不适用
parameters = {'min_impurity_decrease':[*np.linspace(0,0.5,20)]
}
clf = DecisionTreeClassifier(random_state=25, max_depth = 3)
GS = GridSearchCV(clf, parameters, cv=10)
GS.fit(x_train,y_train)
X = GS.best_params_
Y = GS.best_score_
print("best_params_:%s best_score_:%s " % (X,Y))
结论 :综合全部参数进行网格搜索和一个个参数进行网格搜索,我们发现还是全部参数进行网格搜索的准确率最高
3.4 决策树可视化及预测
Step 1:确定 class name
#看看y值是如何排序的,方便后续敲定class_name的时候用
y.unique()
Step 2:建模最有效的模型
#利用网格搜索相关参数,找出最优的参数。
gini_thresholds = np.linspace(0,0.5,20)
parameters = {'splitter':('best','random')
              ,'criterion':("gini","entropy")
              ,"max_depth":[*range(1,10)]
              ,'min_samples_leaf':[*range(1,50,5)]
              ,'min_impurity_decrease':[*np.linspace(0,0.5,20)]
}
clf = DecisionTreeClassifier(random_state=25)
GS = GridSearchCV(clf, parameters, cv=10)
GS.fit(x_train,y_train)
X = GS.best_params_
Y = GS.best_score_
print("best_params_:%s best_score_:%s " % (X,Y))
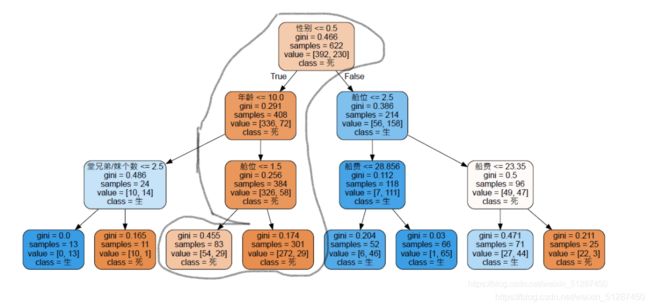
Step 3:根据模型,可视化决策树。
#需要特别注意class_name 和 feature_names的排列。否则会出现很大的失误
feature_name =["舱位","性别","年龄","堂兄弟/妹个数","船费","登船地区"]
dot_data = tree.export_graphviz(clf

                                , feature_names = feature_name
                                , class_names = ["死","生"]
                                , filled = True#圆头的意思
                                , rounded =True#颜色的意思
                                )

graphviz.Source(dot_data)
说了那么多,到底你是否能在那场灾难中存活呢?这涉及许多因素,也许很多人说,只要你是女的,有钱,那就能存活了。 那事实真的如此吗?以下,我将会以决策树进行分析不同背景的人士,并指出他是否能存活。
个人特别喜欢刘德华,那就看看刘德华是否能存活吧。
刘德华:年纪59岁,比较富有,我相信他会买一级座位,然后船票大概300元。
刘德华是否能存活?答案是不能。
根据刘德华的特点代入,他只有死路一条哈哈。
那换个女的吧。我们假设小花,今年十八岁,比较穷,买的第三舱位,票价大概30元。
那我们看看,他能不能存活吧。
小花还是挂了。。。。
如果根据决策树进行分析的话,
条件1:只要你性别是男生,且年龄小于10岁,而兄弟姐妹数量小于2.5个,你才能存活,否则,只要你是个男的,你就挂了。
条件2: 你是个女生,且不太穷,买的舱位是一级和二级座位,那么恭喜你,你是基本能活下来的。反而如果你穷点,买的是三级座位且票价小于23.5元,那么你还有几率活下来,否则只有等死。
接下来会进行更深入的分析,比如模型调参,对比以及按照每个人的条件,预测该人是否会死亡。
3.5 决策树预测
假设1 :小明特点如下
1.座位等级(pclass)是一等位(1)
2.是男生(0)
3.在Southampton上船(2)
4.年龄大概20岁
5.船票80元
6.独生子女
假设2 :小美特点如下
1.座位等级(pclass)是二等位(2)
2.是男生(1)
3.在Questown上船(1)
4.年龄大概50岁
5.船票19元
6.两个孩子(2)
假设3 :老黄特点如下
1.座位等级(pclass)是三等位(3)
2.是女生(1)
3.在Questown上船(1)
4.年龄大概90岁
5.船票380元
6.两个孩子(4)
假设4 :大白特点如下
1.座位等级(pclass)是三等位(1)
2.是女生(1)
3.在Questown上船(1)
4.年龄大概32岁
5.船票100元
6.一个孩子(1)
假设5 :大白特点如下
1.座位等级(pclass)是三等位(3)
2.是女生(0)
3.在Questown上船(1)
4.年龄大概88岁
5.船票5元
6.一个孩子(0)
#决策树的预测
detail_information_2 =[[1,0,20,0,80,2],[2,1,50,2,19,1],[3,1,90,4,380,1],[1,1,32,1,100,1],[3,0,88,0,5,1]]#相关的值
name_2 = ["小明","小美","老黄","大白","Ache"]#人名

predict_survived_2 = rfc.predict(detail_information_2)#预测死或者生
predict_survived_2 = list(predict_survived_2)#将值转换成list
information_2 = pd.DataFrame(detail_information_2)#将数据存入DataFrame
information_2["预测结果"] = predict_survived_2#将死亡记录写入DataFrame
information_2.rename(columns={0:"座位等级",1:"性别",2:"年龄",3:"兄弟姐妹人数",4:"票价",5:"上船的港口"},inplace = True)


predict_proba_2 = rfc.predict_proba(detail_information_2)#预测
predict_proba_2 = pd.DataFrame(predict_proba_2)#将数值转换成DataFrame
predict_proba_2.rename(columns={0:"死亡几率",1:"生存几率"},inplace =True)#修改列名
full_information_2 =  pd.concat([information_2, predict_proba_2], axis=1)#将两个DataFrame进行合并

full_information_2["预测结果"].replace(0, "死",inplace =True)
full_information_2["预测结果"].replace(1, "生",inplace =True)
full_information_2["座位等级"].replace(1, "一等位",inplace =True)
full_information_2["座位等级"].replace(2, "二等位",inplace =True)
full_information_2["座位等级"].replace(3, "三等位",inplace =True)
full_information_2["性别"].replace(0, "男",inplace =True)
full_information_2["性别"].replace(1, "女",inplace =True)
full_information_2["上船的港口"].replace(0, "瑟堡-奥克特维尔 ",inplace =True)
full_information_2["上船的港口"].replace(1, "皇后镇",inplace =True)
full_information_2["上船的港口"].replace(2, "南安普敦",inplace =True)


full_information_2.index = name_2
Part B. 随机森林建模
2..1 随机森林建模
rfc = RandomForestClassifier(n_estimators = 100, random_state = 90)

score_rfc = cross_val_score(rfc,x,y,cv =10).mean()
score_rfc
简单跑一下模型,得分为81分,效果还可以。接下来会进行简单的调参,确定n_estimator数值是多少
2.2 随机森林-确定最优estimator
"""
在这里我们选择学习曲线,可以使用网格搜索吗?可以,但是只有学习曲线,才能看见趋势
我个人的倾向是,要看见n_estimators在什么取值开始变得平稳,是否一直推动模型整体准确率的上升等信息
第一次的学习曲线,可以先用来帮助我们划定范围,我们取每十个数作为一个阶段,来观察n_estimators的变化如何
引起模型整体准确率的变化
"""
scorel = []
for i in tqdm( range(0,200,10), "updating"):
    rfc = RandomForestClassifier(n_estimators=i+1
#                                  ,n_jobs=-1
                                 ,random_state=90)
    score = cross_val_score(rfc,x,y,cv=10).mean()
    scorel.append(score)
print(max(scorel),(scorel.index(max(scorel))*10)+1)#因为每十次循环一次,所以要×10,加1是因为 index 从零开始
plt.figure(figsize=[20,5])
plt.plot(range(1,201,10),scorel)
plt.show() ![]()
在n_estimator 等于 61 的情况下,最佳的分数是0.820045. 但是由于这个是每10次循环一次,可能仍然会存在不准确的情况。所以下面会用 50 到 70 之间的range,再跑一次,看看有没有更优的n_estimator
#看看n_extimator附近参数是否还有的提高。
#结果是没有提高的。
scorel = []
for i in tqdm (range(50,70),"updating"):
    rfc = RandomForestClassifier(n_estimators=i,
                                 n_jobs=-1,
                                 random_state=90)
    score = cross_val_score(rfc,x,y,cv=10).mean()
    scorel.append(score)
print(max(scorel),([*range(50,70)][scorel.index(max(scorel))]))
plt.figure(figsize=[20,5])
plt.plot(range(50,70),scorel)
plt.show()
![]()
数据并没有变化,因此,会在接下来使用n_estimator 等于 61的情况下,进行网格搜索
2.3网格搜索-确定最优参数
#利用网格搜索max_depth参数,找出最优的参数。
parameters = {
              'max_depth':np.arange(1, 20, 1)

}
rfc = RandomForestClassifier(n_estimators = 61, random_state = 90)
GS = GridSearchCV(rfc, parameters, cv=10)
GS.fit(x,y)
X = GS.best_params_
Y = GS.best_score_
print("best_params_:%s best_score_:%s original:0.8200459652706844 " % (X,Y)) ![]()
可以看到max_depth 等于9的时候,分数有所提升。因此接下来的测试会增加这个参数进行网格搜索。
#利用网格搜索max_depth参数,找出最优的参数。
parameters = {
              'min_samples_split':np.arange(2, 2+20, 1)

}
rfc = RandomForestClassifier(n_estimators = 61
                             ,random_state = 90
                             ,max_depth= 9)
GS = GridSearchCV(rfc, parameters, cv=10)
GS.fit(x,y)
X = GS.best_params_
Y = GS.best_score_
print("best_params_:%s best_score_:%s original:0.8200459652706844 adjust_depth:0.8357635342185905 " % (X,Y))![]()
可以看到max_sample_split 等于8的时候,分数有所提升。接下来会利用得到的参数,进行数据建模
2.4 随机森林predict
2.4.1 数据建模
x = data[["Pclass","Sex","Age","SibSp","Fare","Embarked"]]
y = data["Survived"]
rfc = RandomForestClassifier(n_estimators = 61
                             ,random_state = 90
                             ,max_depth= 9
                             ,min_samples_split = 8).fit(x,y)
rfc_score = cross_val_score(rfc,x,y,cv =10).mean()
rfc_score
2.4.2 数据预测
假设1 :小明特点如下
1.座位等级(pclass)是一等位(1)
2.是男生(0)
3.在Southampton上船(2)
4.年龄大概20岁
5.船票80元
6.独生子女
假设2 :小美特点如下
1.座位等级(pclass)是二等位(2)
2.是男生(1)
3.在Questown上船(1)
4.年龄大概50岁
5.船票19元
6.两个孩子(2)
假设3 :老黄特点如下
1.座位等级(pclass)是三等位(3)
2.是女生(1)
3.在Questown上船(1)
4.年龄大概90岁
5.船票380元
6.两个孩子(4)
假设4 :大白特点如下
1.座位等级(pclass)是三等位(1)
2.是女生(1)
3.在Questown上船(1)
4.年龄大概32岁
5.船票100元
6.一个孩子(1)
#随机森林的预测
detail_information =[[1,0,20,0,80,2],[2,1,50,2,19,1],[3,1,90,4,380,1],[1,1,32,1,100,1]]#相关的值
name = ["小明","小美","老黄","大白"]#人名

predict_survived = rfc.predict(detail_information)#预测死或者生
predict_survived = list(predict_survived)#将值转换成list
information = pd.DataFrame(detail_information)#将数据存入DataFrame
information["预测结果"] = predict_survived#将死亡记录写入DataFrame
information.rename(columns={0:"座位等级",1:"性别",2:"年龄",3:"兄弟姐妹人数",4:"票价",5:"上船的港口"},inplace = True)


predict_proba = rfc.predict_proba(detail_information)#预测
predict_proba = pd.DataFrame(predict_proba)#将数值转换成DataFrame
predict_proba.rename(columns={0:"死亡几率",1:"生存几率"},inplace =True)#修改列名
full_information =  pd.concat([information, predict_proba], axis=1)#将两个DataFrame进行合并

full_information["预测结果"].replace(0, "死",inplace =True)
full_information["预测结果"].replace(1, "生",inplace =True)
full_information["座位等级"].replace(1, "一等位",inplace =True)
full_information["座位等级"].replace(2, "二等位",inplace =True)
full_information["座位等级"].replace(3, "三等位",inplace =True)
full_information["性别"].replace(0, "男",inplace =True)
full_information["性别"].replace(1, "女",inplace =True)
full_information["上船的港口"].replace(0, "瑟堡-奥克特维尔 ",inplace =True)
full_information["上船的港口"].replace(1, "皇后镇",inplace =True)
full_information["上船的港口"].replace(2, "南安普敦",inplace =True)


full_information.index = name
根据上表的假设下,得出了是否死亡的结果,并附有死亡及生存几率
Part A 及 Part B的总结: 决策树和随机森林的预测结果,差异并不大。可能两个模型的有效度并不高。
5.模型对比
#可视化看看那个model有效度比较高
score = [clf_socre,rfc_score]
model_name = ["DecisionTree","RandomForest"]
plt.style.use('grayscale')
plt.bar(model_name,score)
可以看到两者的高度差不多,难以分出高下,因此笔者用了饼图进行比较。
plt.figure(figsize=(6,9)) #调节图形大小
colors = ['red','yellowgreen']
plt.pie(score,labels= model_name,colors = colors,autopct = '%3.2f%%')
可以看到随机森林的有效度更高。所以在做预测的时候,会优先选取随机森zuo'we
5.总结
根据决策树可视化而言,只要是男生,死亡率会很高。一般十岁以下的男生能存活,反之基本会挂。而且,女生的话,只有中上阶级的人才能存活,这也符合正常的逻辑推理。
根据决策树及随机森林的预测值来看,主要都是女性及一等位的人存活率越高,还有就是无论那个舱位,男性的死亡率都很高。但是,男性在第三座位死亡率是最高,反之最低是一等位。但是,一等位的死亡率也过半,属于高水平。
而随机森林的有效度更为的高,但是比决策树高的并不多。


