kaggle赛题:波士顿房价分析
公众号:尤而小屋
作者:Peter
编辑:Peter
大家好,我是Peter~
这个是Kaggle专栏的第二篇,赛题名是: House Prices - Advanced Regression Techniques。在本文中,你将会学习到:
- 单、多变量分析
- 相关性分析
- 缺失值、异常值处理
- 哑变量转换
原notebook地址:https://www.kaggle.com/pmarcelino/comprehensive-data-exploration-with-python
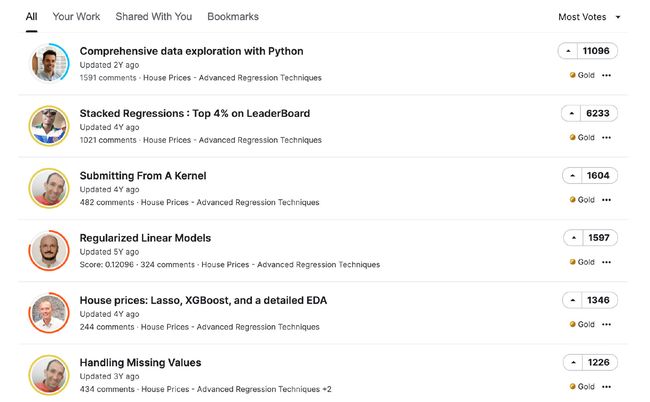
排名榜
让我们看下排名榜,第一名真的是碾压其他选手呀~所以,今天我们一起看看这个第一名的方案到底是多棒?
数据介绍
这份波士顿房价的数据集有4份数据,训练集train+测试集test+数据集的描述description+提交模板sample
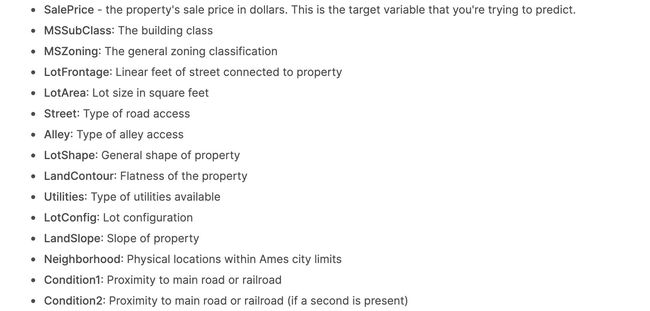
其中训练集有81个特征,1460条数据;测试集81个特征,1459条数据。看下部分属性介绍:
数据EDA
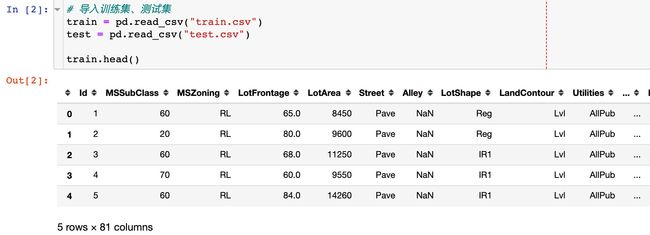
导入模块和数据,并进行数据探索:
导入库
import pandas as pd
import numpy as np
# 绘图相关
import plotly.express as px
import matplotlib.pyplot as plt
import seaborn as sns
plt.style.use("fivethirtyeight")

# 数据建模
from scipy.stats import norm
from scipy import stats
from sklearn.preprocessing import StandardScaler

# 警告
import warnings
warnings.filterwarnings('ignore')
%matplotlib inline
导入数据
数据信息
训练集整体是1460*81;而且很多的存在字段都存在缺失值
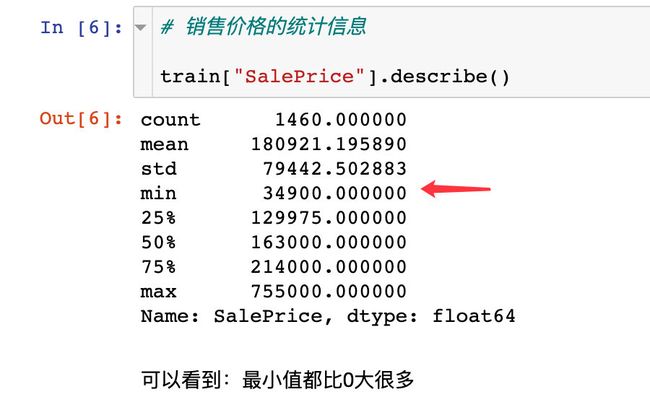
描述统计信息:
销售价格SalePrice分析
前原notebook文档中,作者分析了很多自己关于这个题目和字段的看法,具体不阐述。下面介绍的是重点部分:
统计信息
单单看这个字段的统计信息:
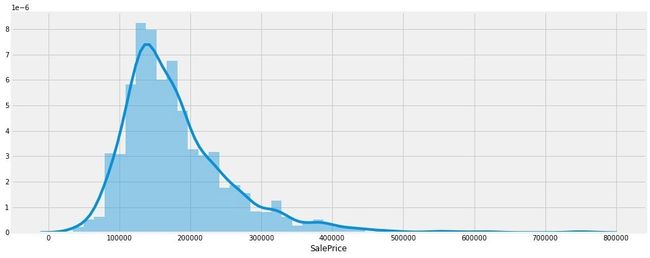
分布直方图如下,我们明显感受到:
- 价格的分布偏离了正态分布
- 有明显的正偏度现象
- 有明显的峰值出现
偏度和峰度(skewness and kurtosis)
知识加油站:偏度和峰度
详细的解释参见文章:https://zhuanlan.zhihu.com/p/53184516
- 偏度:衡量随机变脸概率分布的不对称性,是相对于平均值不对称程度的度量,通过对偏度系数的测量,我们能够判定数据分布的不对称程度以及方向。
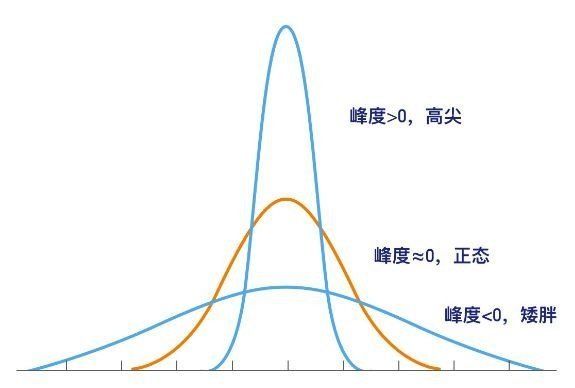
- 峰度:是研究数据分布陡峭或者平滑的统计量,通过对峰度系数的测量,我们能够判定数据相对于正态分布而言是更陡峭还是更平缓。峰度接近0,数据呈现正态分布;峰度>0,高尖分布;峰度<0,矮胖分布
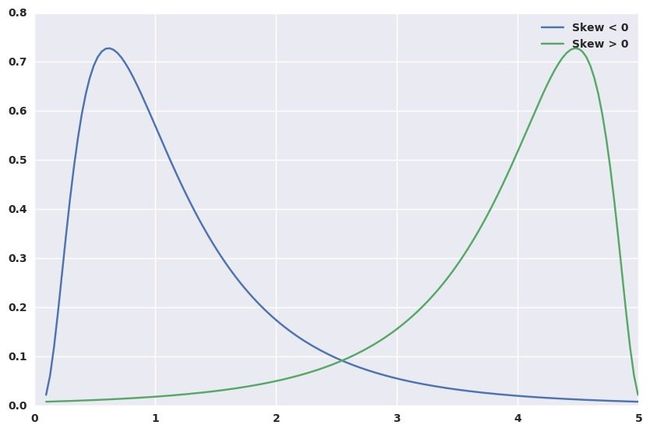
偏度的两种分布情况:
- 如果是左偏,则偏度小于0
- 如果是右偏,则偏度大于0
峰度的两种分布情况:
- 如果是高瘦型,则峰度大于0
- 如果是矮胖型,则峰度小于0
# 打印销售价格的偏度和峰度

print("Skewness(偏度): %f" % train['SalePrice'].skew())
print("Kurtosis(峰度): %f" % train['SalePrice'].kurt())

Skewness(偏度): 1.882876
Kurtosis(峰度): 6.536282
偏度和峰度值都是正的,明显说明数据是右偏且高尖分布
SalePrice和数值型字段的关系
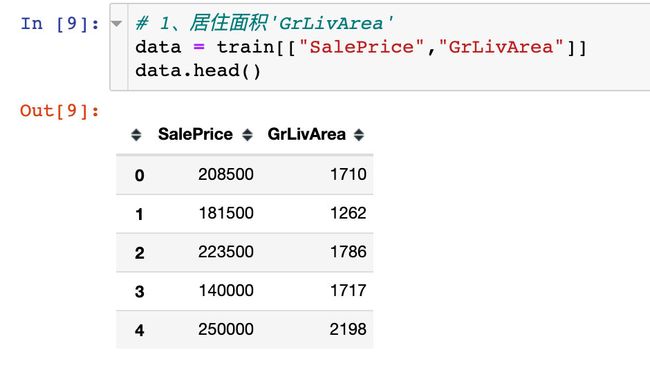
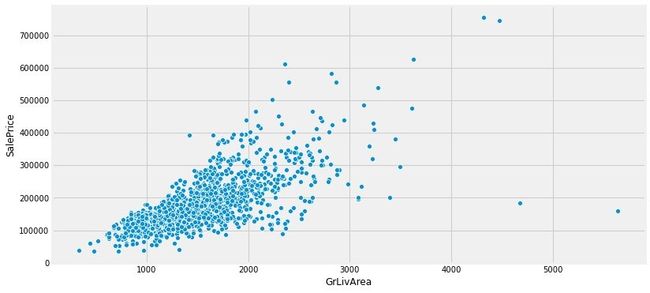
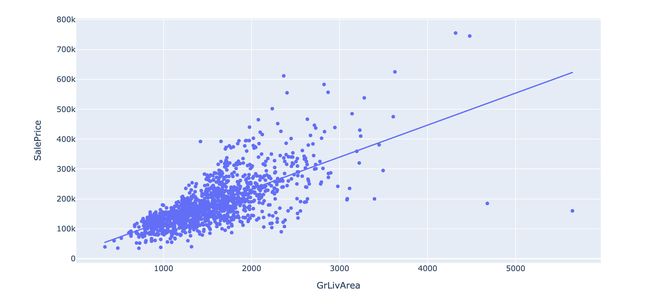
首先我们考察和居住面积的关系:
plt.figure(1,figsize=(12,6))
sns.scatterplot(x="GrLivArea",y="SalePrice",data=data)
plt.show()
# plotly版本
px.scatter(data,x="GrLivArea",y="SalePrice",trendline="ols")
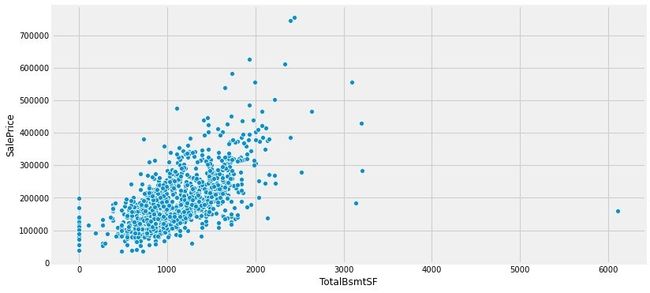
TotalBsmtSF VS SalePrice
# 2、TotalBsmtSF
data = train[["SalePrice","TotalBsmtSF"]]

plt.figure(1,figsize=(12,6))
sns.scatterplot(x="TotalBsmtSF",y="SalePrice",data=data)
plt.show()
小结:我们可以观察到这两个特征和销售价格之间是存在一定的线性关系。
价格和分类型字段的关系
1、OverallQual VS SalePrice
# 1、OverallQual:整体房屋质量

# 总共10个类别
train["OverallQual"].value_counts()
5     397
6     374
7     319
8     168
4     116
9      43
3      20
10     18
2       3
1       2
Name: OverallQual, dtype: int64
data = train[["SalePrice","OverallQual"]]

# 房屋整体质量和房价的关系
# 绘制子图:1号位
f,ax = plt.subplots(1,figsize=(12,6))
fig = sns.boxplot(x="OverallQual",y="SalePrice",data=data)
# y轴的刻度范围
fig.axis(ymin=0,ymax=800000)
plt.show()
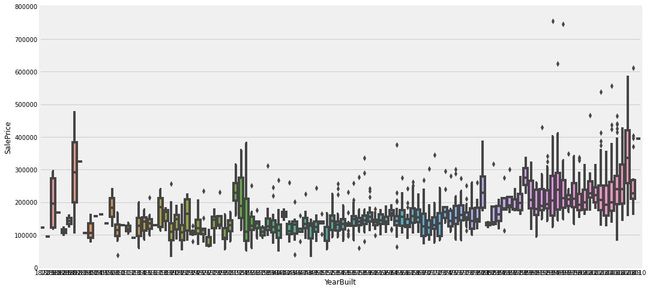
2、YearBuilt VS SalePrice
住在建造年份和销售价格的关系
data = train[["SalePrice","YearBuilt"]]

# 建造年份和房价的关系
f,ax = plt.subplots(1,figsize=(16,8))
fig = sns.boxplot(x="YearBuilt",y="SalePrice",data=data)
# y轴的刻度范围
fig.axis(ymin=0,ymax=800000)
plt.show()
小结:销售价格和住宅的整体质量有很强的关系;但是和建筑年份的关系不大。但是在实际的买房过程中,我们还是会很在意年份
小结
对上面分析的一点小结:
- 地面生活区(GrLivArea)、地下室面积(GrLivArea)和销售价格SalePrice都是呈现正向的线性相关
- 房屋的整体质量(OverallQual)和建造年份(YearBuilt)好像也和销售价格线性相关。常识来说,整体的质量越好,价格越贵
相关性分析
为了探索众多属性之间的关系,进行如下的分析:
- 两两属性间的相关性(热力图)
- 销售价格saleprice和其他属性的关系(热力图)
- 关联性最大的属性间的关系(散点图)
整体相关性
分析每两个属性的相关性,并绘制热力图
上图中有两个值得关注的点:
- TotalBsmtSF and 1stFlrSF
- GarageCar and GarageArea
这两组变量都是强相关的,我们后续的分析只取其中一个
缩放相关矩阵(销售价格saleprice)
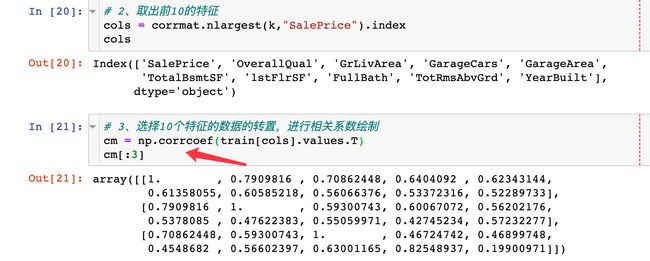
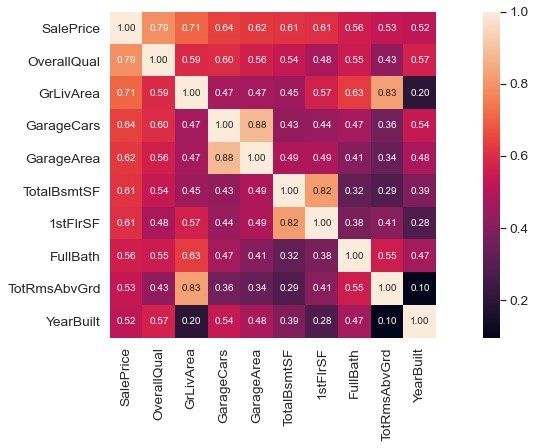
从上面的热力图中选择和SalePrice相关性最强的前10个特征来绘制热力图
sns.set(font_scale=1.25)
hm = sns.heatmap(
    cm,  # 绘图数据
    cbar=True,  # 是否将颜色条作为图例,默认True
    annot=True,  # 是否显示数值
    square=True,  # 是否使热力图每个单元为正方形,默认为False
    fmt='.2f',  # 保留两位小数
    annot_kws={'size':10},
    xticklabels=cols.values, # xy轴设置
    yticklabels=cols.values)

plt.show()
小结1
通过上面的缩放热力图,我们可以得到下面的结论:
- ‘OverallQual’, ‘GrLivArea’ and 'TotalBsmtSF’是真的和’SalePrice’呈现强相关
- ‘GarageCars’ and ‘GarageArea’ 也是两个相关性比较强的特征;而且他们都是同时出现,后续选取GarageCars进行分析
- 建筑年限’YearBuilt’相对来说,相关性比较低
变量离散图
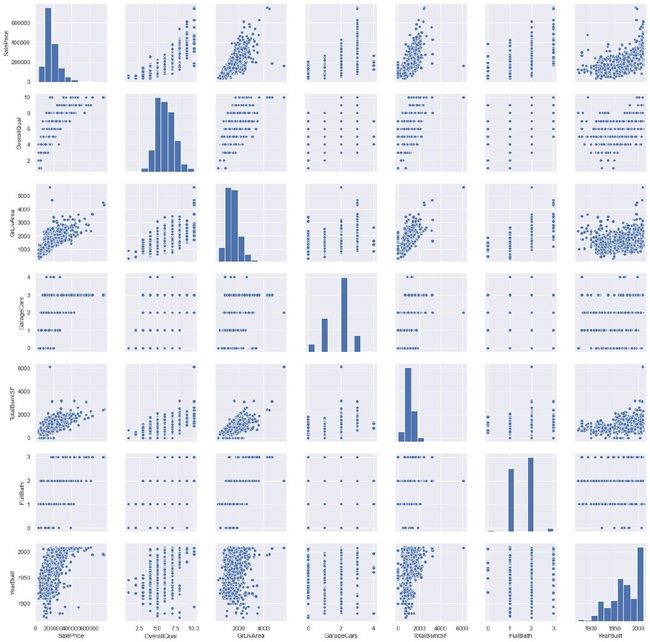
将销售价格SalePrice和几个相关性比较强的特征放在一起,绘制变量离散图
sns.set()
# 待分析的变量
cols = ['SalePrice', 'OverallQual', 'GrLivArea', 'GarageCars', 'TotalBsmtSF', 'FullBath', 'YearBuilt']
sns.pairplot(train[cols],size=2.5)
plt.show()
小结2
正对角线方向上是变量的直方图,解释变量和被解释变量SalePrice,其他的则是散点图。
如果图中呈现直线或者横线的散点,则说明该变量是离散的,比如第1行4列的变量,y轴是SalePrice,x轴是YearBuilt,直线说明YearBuilt是离散的
缺失值处理
针对缺失值的情况,主要是讨论两点:
- 缺失值分布情况怎么样?
- 缺失值是随机的?还有具有某种规律
缺失值占比
1、查看每个字段的缺失值情况
# 每个字段的缺失值数量:降序
total = train.isnull().sum().sort_values(ascending=False)
total.head()
PoolQC         1453
MiscFeature    1406
Alley          1369
Fence          1179
FireplaceQu     690
dtype: int64
2、转成百分比
# 每个字段的缺失值 / 总数
percent = (train.isnull().sum() / train.isnull().count()).sort_values(ascending=False)
percent.head()
PoolQC         0.995205
MiscFeature    0.963014
Alley          0.937671
Fence          0.807534
FireplaceQu    0.472603
dtype: float64
3、数据合并,整体的缺失值情况:
删除缺失值
原文中分析了很多,最后的结论:
In summary, to handle missing data,
1、we’ll delete all the variables with missing data, except the variable ‘Electrical’.
2、In ‘Electrical’ we’ll just delete the observation with missing data.
# 步骤1:需要删除的字段
missing_data[missing_data["Total"] > 1].index
Index(['PoolQC', 'MiscFeature', 'Alley', 'Fence', 'FireplaceQu', 'LotFrontage',
       'GarageYrBlt', 'GarageCond', 'GarageType', 'GarageFinish', 'GarageQual',
       'BsmtFinType2', 'BsmtExposure', 'BsmtQual', 'BsmtCond', 'BsmtFinType1',
       'MasVnrArea', 'MasVnrType'],
      dtype='object')
# 第一步
train = train.drop(missing_data[missing_data["Total"] > 1].index,1)
#	第二步
train = train.drop(train.loc[train["Electrical"].isnull()].index)
离群点out liars
查找离群点
## 数据标准化standardizing data
# np.newaxis 增加数据维度,一维变成二维
saleprice_scaled = StandardScaler().fit_transform(train["SalePrice"][:,np.newaxis])
saleprice_scaled[:5]
array([[ 0.34704187],
       [ 0.0071701 ],
       [ 0.53585953],
       [-0.5152254 ],
       [ 0.86943738]])
# 查看前10和最后10位的数据
# argsort:返回的是索引值;默认是升序排列,最小的在最前面,最大的在最后

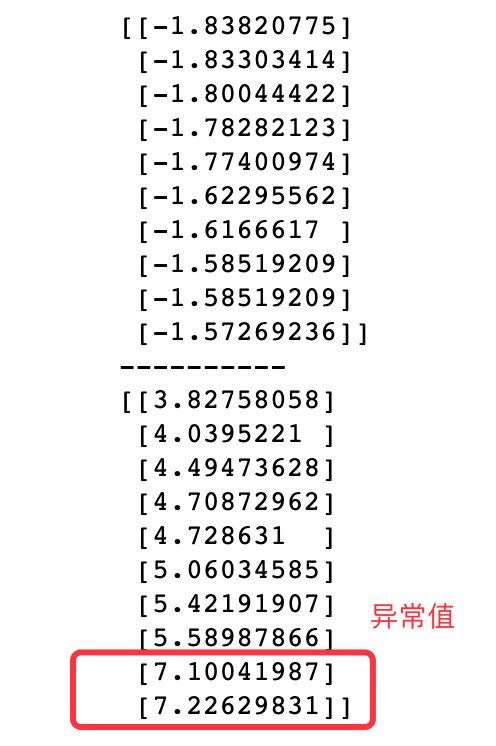
low_range = saleprice_scaled[saleprice_scaled[:,0].argsort()][:10]

high_range = saleprice_scaled[saleprice_scaled[:,0].argsort()][-10:]

print(low_range)
print('----------')
print(high_range)
小结3
- low_range接近,且离0比较近
- high_range离0很远;且7+的数据就应该是离群点了
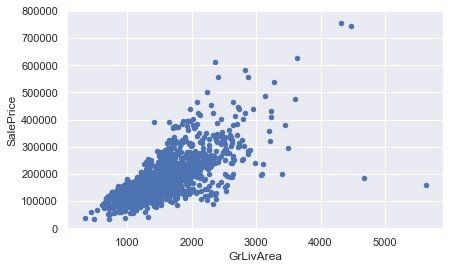
单变量分析1
data = train[["SalePrice","GrLivArea"]]
data.plot.scatter(x="GrLivArea",y="SalePrice",ylim=(0,800000))
plt.show()
很明显的,两个变量(属性)存在一种线性关系
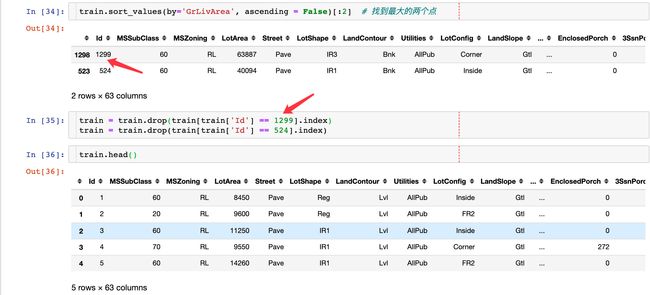
删除离群点
指定删除某个字段为具体值的方法:
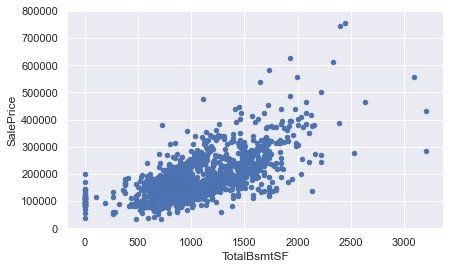
单变量分析2
data = train[["SalePrice","TotalBsmtSF"]]   # 待分析的两个变量
data.plot.scatter(x="TotalBsmtSF",y="SalePrice",ylim=(0,800000))
plt.show()
深入理解SalePrice
主要从以下几个方面来深入研究销售价格:
- Normality:归一化
- Homoscedasticity:同方差性
- Linearity:线性特质
- Absence of correlated errors:相关误差
Normality归一化(SalePrice)
sns.distplot(train["SalePrice"],fit=norm)
fig = plt.figure()
res = stats.probplot(train["SalePrice"], plot=plt)
我们发现:销售价格不是正态分布的,出现了右偏度;同时也不遵循对数变化的规律。
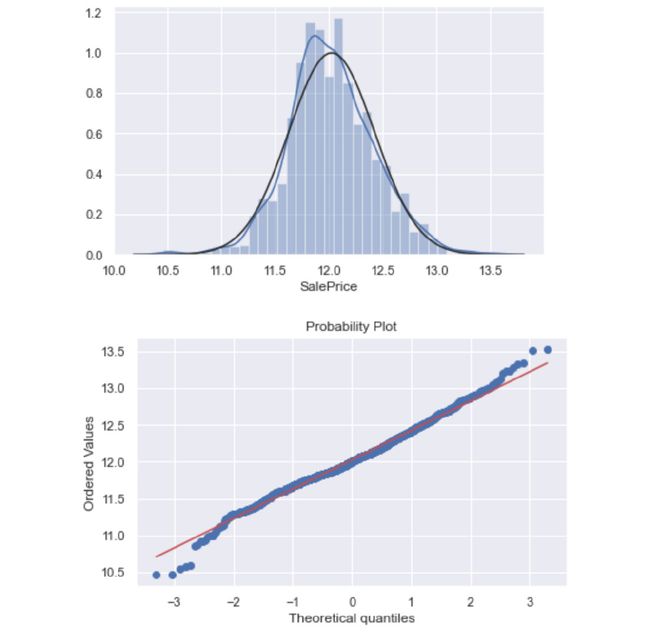
为了解决这个问题:实施对数变换
## 对数变换
train["SalePrice"] = np.log(train["SalePrice"])

sns.distplot(train["SalePrice"],fit=norm)
fig = plt.figure()
res = stats.probplot(train["SalePrice"], plot=plt)
实施对数变换后效果好了很多的
Normality-归一化(GrLivArea)
sns.distplot(train["GrLivArea"],fit=norm)
fig = plt.figure()
res = stats.probplot(train["GrLivArea"], plot=plt)
对数变换前的效果:
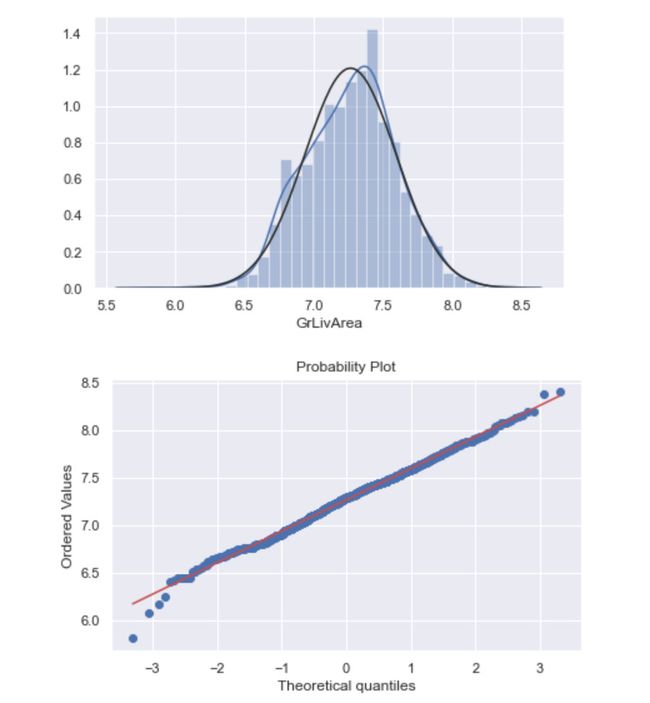
执行对数变换及效果:
# 执行相同的对数操作
train["GrLivArea"] = np.log(train["GrLivArea"])

sns.distplot(train["GrLivArea"],fit=norm)
fig = plt.figure()
res = stats.probplot(train["GrLivArea"], plot=plt)
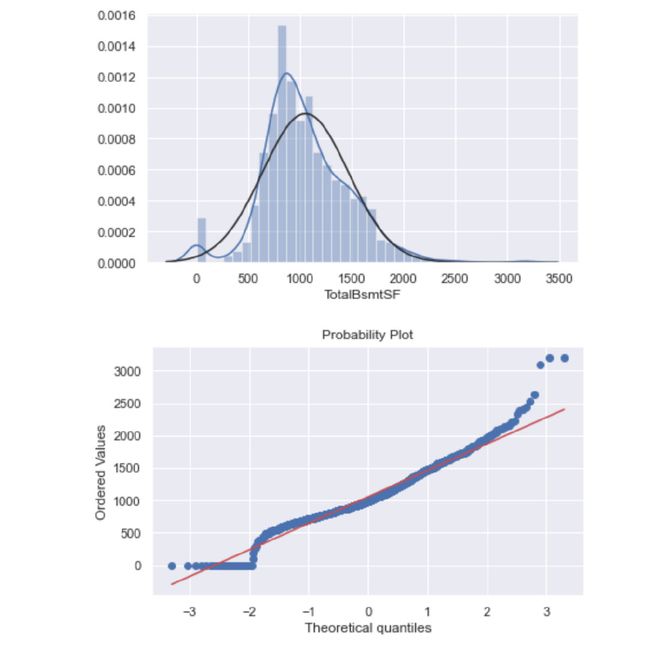
Normality-归一化(TotalBsmtSF)
sns.distplot(train["TotalBsmtSF"],fit=norm)
fig = plt.figure()
res = stats.probplot(train["TotalBsmtSF"], plot=plt)
处理之前的效果:
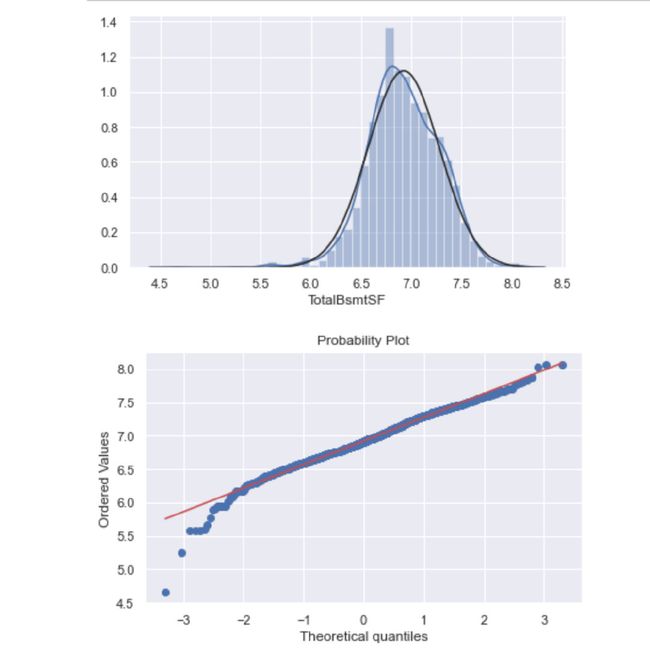
如何处理上面的特殊部分?
# 增加一列数据
train['HasBsmt'] = 0

# 当TotalBsmtSF>0 则赋值1
train.loc[train['TotalBsmtSF']>0,'HasBsmt'] = 1

# 对数转换:等于1的部分
train.loc[train['HasBsmt']==1,'TotalBsmtSF'] = np.log(train['TotalBsmtSF'])

# 绘图
data = train[train['TotalBsmtSF']>0]['TotalBsmtSF']
sns.distplot(data,fit=norm)
fig = plt.figure()
res = stats.probplot(data, plot=plt)
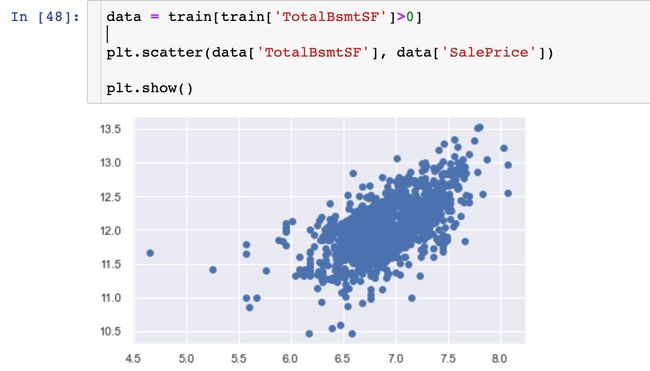
同方差性
检验两个变量之间的同方差性最好的方法就是作图。
The best approach to test homoscedasticity for two metric variables is graphically
1、讨论:‘SalePrice’ 和’GrLivArea’之间的关系
2、讨论SalePrice’ 和 ‘TotalBsmtSF’
We can say that, in general, ‘SalePrice’ exhibit equal levels of variance across the range of ‘TotalBsmtSF’. Cool!
从上面的两张图中,我们看到:销售价格和另外两个变量都是呈现一定的正向关系
生成哑变量
虚拟变量( Dummy Variables) 又称虚设变量、名义变量或哑变量,用以反映质的属性的一个人工变量,是量化了的自变量,通常取值为0或1。
Pandas中的get_dummies函数能够实现:
train = pd.get_dummies(train)  # 生成哑变量
train
总结
至此,我们完成了以下的内容:
- 整体变量间的相关性分析
- 重点分析了变量“SalePrice”
- 处理缺失值和异常值(离群点)
- 做了一些统计分析,将分类变量变成了哑变量
自己需要后续补充深入学习的点:
- 多元统计分析
- 偏度和峰度
- 哑变量的深入
- 标准化和归一化
关于数据集的领取,公众号后台回复:房价。看完整篇文章的分析过程,有什么感受呢?

