python图像处理-形状提取和识别1(基于Hough的形状提取)
python图像处理-形状提取和识别1
(基于Hough的形状提取)
本系列一个分为两大部分:一个是形状提取,一个是形状识别
1.形状提取中,基于Hough函数法进行直线提取和圆形提取,还有即基于颜色的形状提取
这里扩展了一个小程序(识别一张棋盘图片,利用角点检测得到棋盘参数,再利用形状提取得到棋子位置,将棋盘图片转换成矩阵,再利用棋子圆心的RGB识别,用矩阵中的1表示黑子,0表示白子。“后面会把这个小扩展单独写出来玩”)
2.形状识别里用了几个OPEN-CV的函数
目录
- python图像处理-形状提取和识别1
- 第一部分:形状提取
-
- 1.基于Hough函数法进行直线提取
- 2.基于Hough函数法进行圆形提取
- 3.基于颜色进行形状提取
- 4.参考
- 第二部分:扩展-棋盘转换为矩阵
- 第三部分:形状识别
第一部分:形状提取
1.基于Hough函数法进行直线提取
cv2.HoughLines()和cv2.HoughLinesP()两种库函数
前者的方法是检测每一个轮廓点,再拟合成一条直线;后者是返回直线的两个端点。
cv2.HoughLines()的参数含义:
● image 是输入图像,即源图像,必须是 8 位的单通道二值图像。如果是其他类型的图像,在进行霍夫变换之前,需要将其修改为指定格式。
● rho 为以像素为单位的距离 r 的精度。一般情况下,使用的精度是1.0。
● theta 为角度的精度。一般情况下,使用的精度是pi/180,表示要搜索所有可能的角度。
● threshold 是判定直线的阈值。该值越小,判定出的直线就越多。
cv2.HoughLinesP()要多两个参数
● minLineLength - 线的最小长度。比这短的线段被拒绝。
● maxLineGap - 线段之间的最大允许间隙,将它们视为一条线。
这里的几个参数都需要调试好,否则效果都会很差。
img = cv2.imread('D:/classofmathpicture/detection/project/line_load.jpg')
img1=img.copy()
img2=img.copy()
gray = cv2.cvtColor(img,cv2.COLOR_BGR2GRAY)
edges = cv2.Canny(gray,100,200,apertureSize = 3)
lines_houghlines = cv2.HoughLines(edges,1.0,np.pi/180,120)
for line in lines_houghlines:
    rho,theta = line[0]
    a = np.cos(theta)
    b = np.sin(theta)
    x0 = a*rho
    y0 = b*rho
    x1 = int(x0 + 1000*(-b))
    y1 = int(y0 + 1000*(a))
    x2 = int(x0 - 1000*(-b))
    y2 = int(y0 - 1000*(a))
    cv2.line(img1,(x1,y1),(x2,y2),(0,0,255),2)
plt.figure(figsize=(30, 20));
plt.subplot(121);plt.imshow(img1);plt.title('lines_houghlines');plt.axis('off');

lines_p = cv2.HoughLinesP(edges,1,np.pi/180,50,minLineLength=20,maxLineGap=2)
for line in lines_p:
    x1,y1,x2,y2 = line[0]
    cv2.line(img2,(x1,y1),(x2,y2),(0,0,255),2)

plt.subplot(122);plt.imshow(img2);plt.title('lines_houghlinesP');plt.axis('off');

结论:line_houghlines函数由于是选取直线上最多的点数,进而拟合成一条直线,误判比较大,阈值也很难取;而改进后的lines_houghlinesP通过连接线的端点,并且可以设置选取端点距离(最短线的长度)和端点之间的距离(两条线之间的最大间隔距离)
2.基于Hough函数法进行圆形提取
主要用到的是cv2.HoughCircles(gray, cv2.HOUGH_GRADIENT, 1, 200, param1=100, param2=30, minRadius=300, maxRadius=400)函数,若有n个圆形,则将检测输出n个(x,y,r)的向量,xy表示圆形坐标,r表示半径。
img = cv2.imread('D:/classofmathpicture/detection/project/circle2.png',1)
img = cv2.cvtColor(img, cv2.COLOR_BGR2RGB)
gray = cv2.cvtColor(img, cv2.COLOR_BGR2GRAY)
plt.figure(figsize=(30, 20));
plt.subplot(121), plt.imshow(img)
plt.title('img'), plt.xticks([]), plt.yticks([])
circle1 = cv2.HoughCircles(gray, cv2.HOUGH_GRADIENT, 1, 200, param1=100, param2=30, minRadius=300, maxRadius=400)
circles = circle1[0, :, :]  # 提取为二维
circles = np.uint16(np.around(circles))  # 四舍五入,取整
for i in circles[:]:
    cv2.circle(img, (i[0], i[1]), i[2], (255, 0, 0), 5)  # 画圆
    cv2.circle(img, (i[0], i[1]), 2, (255, 0, 0), 10)  # 画圆心

plt.subplot(122), plt.imshow(img)
plt.title('circle'), plt.xticks([]), plt.yticks([]);
3.基于颜色进行形状提取
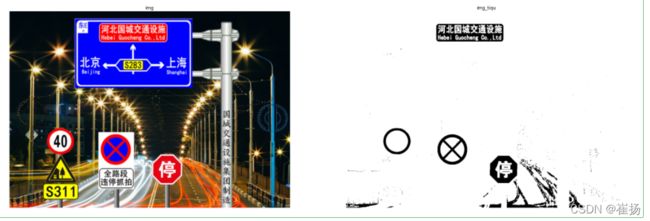
基于颜色的思想就很简单,主要用于警示标语或者其他提示性颜色的图像中的形状提取。
img_flag=cv2.imread('D:/classofmathpicture/stop2.png',1)
img_flag_C=cv2.cvtColor(img_flag,cv2.COLOR_BGR2RGB)
def colorless(image):
    image1=np.zeros((len(image),len(image[1]),3),dtype=int)
#     image=SimpleImage(filename)
    for i in range(len(image)):
        for j in range(len(image[1])):
            avg=(int(image[i,j,0]) + int(image[i,j,1])+ int(image[i,j,2]))/3;
            if image[i,j,0] > 2*avg:
                image1[i,j,0] = 0
                image1[i,j,1] = 0
                image1[i,j,2] = 0
            else:
                image1[i,j,0] = 255
                image1[i,j,1] = 255
                image1[i,j,2] = 255
    return image1
img_flag_ext=colorless(img_flag_C)
plt.figure(figsize=(30, 20));
plt.subplot(121);plt.imshow(img_flag_C);plt.title('img');plt.axis('off');
plt.subplot(122);plt.imshow(img_flag_ext);plt.title('img_tiqu');plt.axis('off');
这是提取红色形状的部分

将上述的判断语句image[i,j,0] > 2*avg改为,就意味着提取蓝色部分
image[i,j,1] > 2*avg
4.参考
https://blog.csdn.net/WZZ18191171661/article/details/91045219
https://blog.csdn.net/weixin_45265581/article/details/106436254
https://blog.csdn.net/qq_44223394/article/details/108169597

