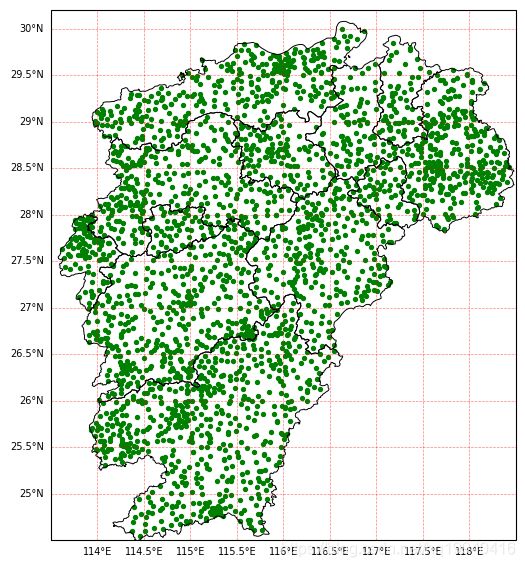
利用python将站点绘制在地图上
利用cartopy进行地图的绘制,利用matplotlib将站点经纬度画入地图上。
程序如下:
import numpy as np
import cartopy.crs as ccrs
import cartopy.feature as cfeat
from cartopy.mpl.gridliner import LONGITUDE_FORMATTER, LATITUDE_FORMATTER
from cartopy.io.shapereader import Reader
import matplotlib.pyplot as plt
import matplotlib.ticker as mticker

shp_path=r'E:/python/map/江西省/江西省.shp'#确定shp文件地址

proj= ccrs.PlateCarree()  # 简写投影
fig = plt.figure(figsize=(6, 9), dpi=100)  # 创建画布
ax = fig.subplots(1, 1, subplot_kw={'projection': proj})  # 创建子图

extent=[113.5,118.5,24.5,30.2]#限定绘图范围
reader = Reader(shp_path)
enshicity = cfeat.ShapelyFeature(reader.geometries(), proj, edgecolor='k', facecolor='none')
ax.add_feature(enshicity, linewidth=0.7)#添加市界细节
ax.set_extent(extent, crs=proj)

gl = ax.gridlines(crs=ccrs.PlateCarree(), draw_labels=True, linewidth=0.5, color='r', alpha=0.5, linestyle='--')
gl.xlabels_top = False  # 关闭顶端的经纬度标签
gl.ylabels_right = False  # 关闭右侧的经纬度标签
gl.xformatter = LONGITUDE_FORMATTER  # x轴设为经度的格式
gl.yformatter = LATITUDE_FORMATTER  # y轴设为纬度的格式
gl.xlocator = mticker.FixedLocator(np.arange(extent[0], extent[1]+0.5, 0.5))
gl.ylocator = mticker.FixedLocator(np.arange(extent[2], extent[3]+0.5, 0.5))
gl.xlabel_style={'size':7}
gl.ylabel_style={'size':7}


f = open('E:/weather/point.txt','r',encoding='utf-8')
text = f.readlines()
l = len(text)
lon = np.zeros(l)
lat = np.zeros(l)
for i in range(l):
    str_point_information = text[i].replace('\n','')
    list_point_information = str_point_information.split(", ") #split()函数拆分字符串,将字符串转化为列表
    lon[i] = list_point_information[1]
    lat[i] = list_point_information[2]

plt.scatter(lon, lat, s=8, c='g')# 标注出所在的点,s为点的大小,还可以选择点的性状和颜色等属性
f.close
得到的结果图像:
其中gl的程序块为绘制地图上的经纬度虚线,可以删去。
