使用Tensorflow2和Pytorch实现线性回归
使用Tensorflow2和Pytorch实现线性回归
- 步骤
- Tensorflow2代码
-
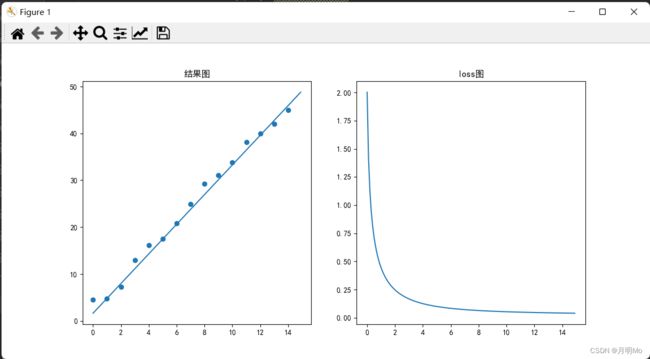
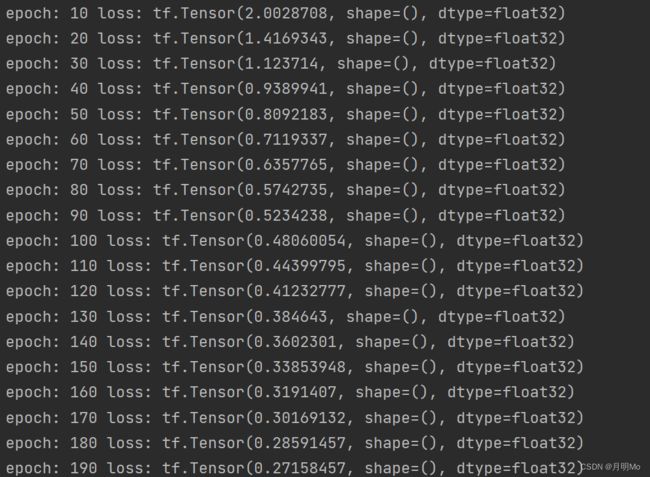
- 效果
- Pytorch代码
-
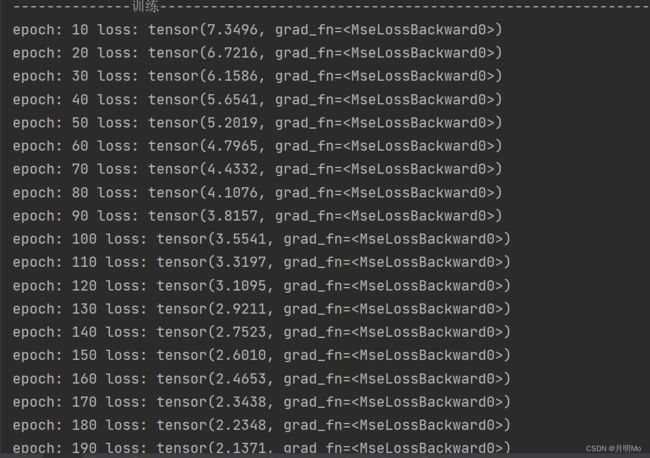
- 效果
步骤
准备步骤:
1. 创建数据集
2. 设置超参数
3. 创建模型(函数)
4. 选择损失函数
5. 选择优化器
训练步骤:
6. 通过模型(函数)前向传播
7. 计算损失
8. 对超参数求梯度
9. 使用优化器利用梯度调整超参数
测试步骤:
10. 创建测试集
11. 通过模型得到预测结果
12. 画出散点图和曲线图
Tensorflow2代码
import tensorflow as tf
import numpy as np
from tensorflow.keras import Model
from tensorflow.keras.losses import MeanSquaredLogarithmicError
from tensorflow.keras.optimizers import SGD
import matplotlib.pyplot as plt

#初始化参数
x=tf.reshape(tf.range(0,15,dtype=tf.float32),[15,1])
y=3*x+tf.constant(np.random.randn(15,1).astype(np.float32))+4
w=tf.Variable(np.random.rand(),dtype=tf.float32)
b=tf.Variable(np.random.rand(),dtype=tf.float32)

print('x=',np.reshape(x,[1,15]),'\ny=',np.reshape(y,[1,15]),'\nw=',w,'\nb=',b)

#创建模型
class My_model(Model):
    def __init__(self):
        super().__init__()

    # 构建一个线性层
    def linear(self,x):
        return w*x+b

    def call(self,x):
        x=self.linear(x)
        return x

#定义超参数
epoch=1500 #迭代次数
Ir=0.01 #学习率
model=My_model() #初始化模型
optimizer=SGD(learning_rate=Ir) #初始化优化器
losser=MeanSquaredLogarithmicError() #初始化损失函数
all_loss=[] #用于存储loss

print('--------------训练------------------------------------------------------------------')

for i in range(1,epoch+1):
    with tf.GradientTape() as tape:
        cy = model(x)  # 前向传播,获得预测值
        loss = losser(cy, y) #计算loss
        grad=tape.gradient(loss,[w,b]) #求出w,b的梯度
    optimizer.apply_gradients(zip(grad,[w,b]))
    if i%10==0:
        all_loss.append(loss) #添加loss
        print('epoch:',i,'loss:',loss) #打印loss值

print('w:',w,'\nb:',b)
print('--------------测试------------------------------------------------------------------')
#画图
plt.rcParams['font.sans-serif']=['SimHei'] #载入字体
px=tf.reshape(tf.range(0,15,0.1,dtype=tf.float32),[150,1])
py=model(px)
plt.subplot(121)
plt.title('结果图')
plt.scatter(x,y)
plt.plot(px.numpy(),py.numpy())
plt.subplot(122)
plt.title('loss图')
plt.plot(px.numpy(),all_loss)
plt.show()
效果
Pytorch代码
import torch as th
from torch.nn import Module,Linear,MSELoss
from torch.optim import SGD
import matplotlib.pyplot as plt

#初始化参数
x=th.arange(0,15,1,dtype=th.float32).view(15,1)
y=3*x+th.randn(15,1,dtype=th.float32)+4
w=th.rand(1)
b=th.rand(1)
print('x=',x.view(1,15),'\ny=',y.view(1,15),'\nw=',w,'\nb=',b)
print('--------------训练------------------------------------------------------------------')
#创建模型
class My_model(Module):
    def __init__(self,input_shape,output_shape):
        super().__init__()
        self.linear=Linear(input_shape,output_shape)

    def forward(self,x):
        x=self.linear(x)
        return x

#定义超参数
epoch=1500 #迭代次数
Ir=0.01 #学习率
model=My_model(1,1) #初始化模型
optimizer=SGD(model.parameters(),Ir) #初始化优化器
losser=MSELoss() #初始化损失函数
all_loss=[] #用于存储loss

for i in range(1,epoch+1):
    optimizer.zero_grad() #将优化器的梯度清零,防止叠加
    cy=model(x)  #前向传播,获得预测值
    loss=losser(cy,y)
    loss.backward() #计算loss和反向传播
    optimizer.step() #更新权重
    if i%10==0:
        all_loss.append(loss)
        print('epoch:',i,'loss:',loss) #打印loss值

print(optimizer.state)
print('--------------测试------------------------------------------------------------------')
#画图
plt.rcParams['font.sans-serif']=['SimHei'] #载入字体
px=th.arange(0,15,0.1,dtype=th.float32,requires_grad=False).view(150,1)
py=model(px)
plt.subplot(121)
plt.title('结果图')
plt.scatter(x,y)
plt.plot(px.detach().numpy(),py.detach().numpy())
plt.subplot(122)
plt.title('loss图')
plt.plot(px.detach().numpy(),all_loss)
plt.show()


