Python实现遗传算法(GA)+支持向量回归机(SVR)
本实验使用环境为Anaconda3 Jupyter,调用Sklearn包,请提前准备好。
1.引入一些常见包
主要包含pandas、numpy、绘图包、SVR、标准化、验证函数等包。
from sklearn.metrics import accuracy_score
from sklearn.metrics import confusion_matrix
from sklearn.metrics import classification_report
from sklearn.metrics import explained_variance_score
from sklearn.preprocessing import StandardScaler
from sklearn.model_selection import train_test_split
import pandas as pd
import numpy as np
import time
from sklearn import metrics
import csv
from sklearn.svm import SVR
import matplotlib.pyplot as plt
2.引入数据
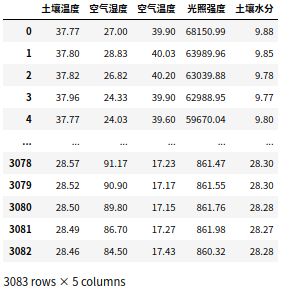
将准备好的CSV文件导入,将数据分为目标集和特征集,比如本文预测’土壤水分’,使用’土壤温度’,‘空气湿度’,‘空气温度’,'光照强度’作为特征。使用pands进行格式化显示。
#全部数据
data=[]
#特征集
traffic_feature=[]
#目标集
traffic_target=[]
#打开数据文件
csv_file = csv.reader(open('turang.csv'))
#遍历 格式设置为float
for content in csv_file:
    content=list(map(float,content))
    if len(content)!=0:
        data.append(content)
        traffic_feature.append(content[0:4])
        traffic_target.append(content[-1])
#将数据变成np.array的格式
data=np.array(data)
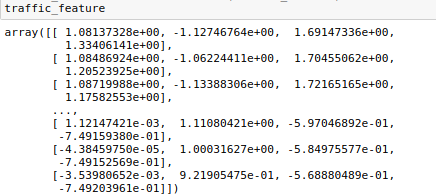
traffic_feature=np.array(traffic_feature)
traffic_target=np.array(traffic_target)
#更直观的观察数据,本文中没有太多用途
df=pd.DataFrame(data=data,columns = ['土壤温度','空气湿度','空气温度','光照强度','土壤水分'])
数据最终样子 输入df即可查看
目标值图:
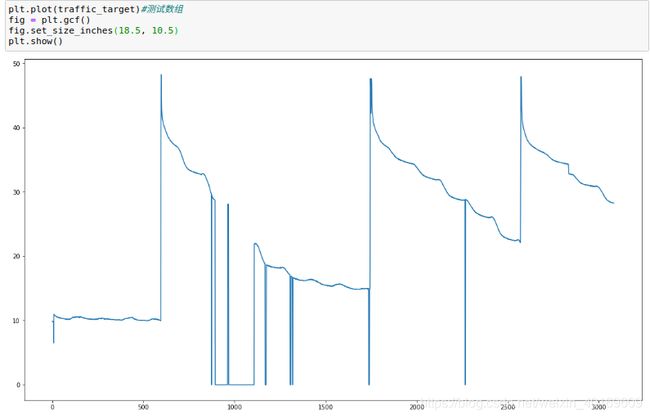
(噪音有点大…先将就用吧 - -!!,以后我会写一篇数据降噪的文章)
plt.plot(traffic_target)#测试数组
fig = plt.gcf()
fig.set_size_inches(18.5, 10.5)
plt.show()
3.数据标准化
使用StandardScaler()方法将数据标准化归一化。
scaler = StandardScaler() # 标准化转换
scaler.fit(traffic_feature)  # 训练标准化对象
traffic_feature= scaler.transform(traffic_feature)   # 转换数据集
4.使用支持向量回归机(SVR)
先将数据随机90%做测试集,剩下10%当验证集,随机种子任意设置。本文采取随机抽取形式,而不是时间序列。如使用时间序列预测,请将特征集和目标集的后10%留出来,做为验证集。同理如单步时间序列与从,则保留最后一行作为验证集。
如:
feature_test=traffic_feature[int(len(traffic_feature)*0.9):int(len(traffic_feature))]
target_test=traffic_target[int(len(traffic_target)*0.9):int(len(traffic_target))]
使用SVR(),参数默认,使用R方、EVS、时间作为评价指标。
feature_train,feature_test,target_train, target_test = train_test_split(traffic_feature,traffic_target,test_size=0.1,random_state=10)

start1=time.time()
model_svr = SVR()
model_svr.fit(feature_train,target_train)
predict_results1=model_svr.predict(feature_test)
end1=time.time()

plt.plot(target_test)#测试数组
plt.plot(predict_results1)#测试数组
plt.legend(['True','SVR'])
fig = plt.gcf()
fig.set_size_inches(18.5, 10.5)
plt.title("SVR")  # 标题
plt.show()
print("EVS:",explained_variance_score(target_test,predict_results1))
print("R2:",metrics.r2_score(target_test,predict_results1))
print("Time:",end1-start1)
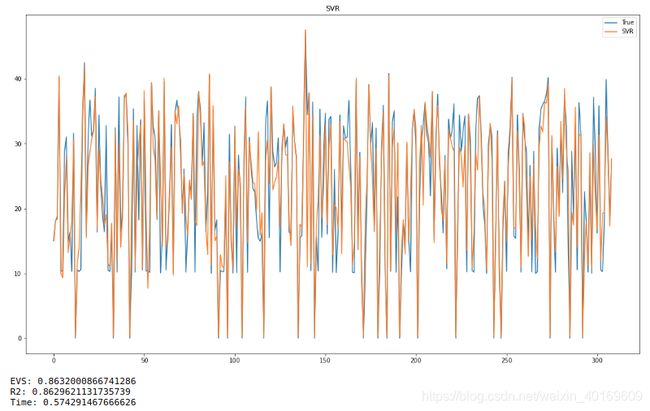
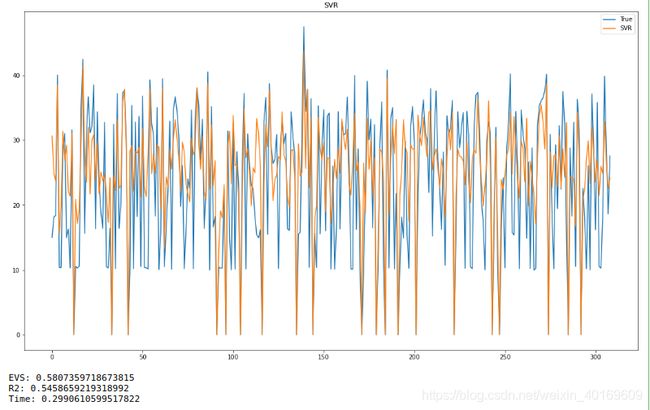
结果:
看的出来,随机抽取的精度不高,R方只有区区0.54。(废话,噪音那么大,精度能高吗…)
时间序列预测结果更离谱,我就不放图了。
5.使用GA算法对SVR进行调参
对SVR参数的惩罚参数C、损失函数epsilon、核系数gamma进行调参,设置其范围为[0,10]、[0,2]、[0,100],可以自行设置。一共20代,每代10人,可以自行设置。
GA算法简单来说,就是每一代人都会有人基因突变,基因突变如果效果很好,适应度很高,那么其他人也会向其进化。
上代码:
#设置适应度,这里设置为R2
def msefunc(predictval,realval):
    print("R2 = ",metrics.r2_score(realval,predictval)) # R2
    return metrics.r2_score(realval,predictval)
 #设置优化函数,这里为SVR,参数在此绑定,使用验证集输入验证得出适应度
def SVMResult(vardim, x, bound):
    X = feature_train.tolist()
    y = target_train.tolist()
    c=x[0]
    e=x[1]
    g=x[2]
    clf = SVR(C=c,epsilon=e,gamma=g)
    clf.fit(X, y)
    predictval=clf.predict(feature_test.tolist())
    return msefunc(predictval,target_test.tolist())
class GAIndividual:

    '''
    individual of genetic algorithm
    '''

    def __init__(self,  vardim, bound):
        '''
        vardim: dimension of variables
        bound: boundaries of variables
        '''
        self.vardim = vardim
        self.bound = bound
        self.fitness = 0.

    def generate(self):
        '''
        generate a random chromsome for genetic algorithm
        '''
        len = self.vardim
        rnd = np.random.random(size=len)
        self.chrom = np.zeros(len)
        for i in range(0, len):
            self.chrom[i] = self.bound[0, i] + \
                (self.bound[1, i] - self.bound[0, i]) * rnd[i]

    def calculateFitness(self):
        '''
        calculate the fitness of the chromsome
        '''
        self.fitness = SVMResult(self.vardim, self.chrom, self.bound)

import random
import copy


class GeneticAlgorithm:

    '''
    The class for genetic algorithm
    '''

    def __init__(self, sizepop, vardim, bound, MAXGEN, params):
        '''
        sizepop: population sizepop人口规模
        vardim: dimension of variables变量维数
        bound: boundaries of variables变量边界
        MAXGEN: termination condition终止条件
        param: algorithm required parameters, it is a list which is consisting of crossover rate, mutation rate, alpha
        '''
        self.sizepop = sizepop
        self.MAXGEN = MAXGEN
        self.vardim = vardim
        self.bound = bound
        self.population = []
        self.fitness = np.zeros((self.sizepop, 1))
        self.trace = np.zeros((self.MAXGEN, 3))
        self.params = params

    def initialize(self):
        '''
        initialize the population
        '''
        for i in range(0, self.sizepop):
            ind = GAIndividual(self.vardim, self.bound)
            ind.generate()
            self.population.append(ind)

    def evaluate(self):
        '''
        evaluation of the population fitnesses
        '''
        for i in range(0, self.sizepop):
            self.population[i].calculateFitness()
            self.fitness[i] = self.population[i].fitness

    def solve(self):
        '''
        evolution process of genetic algorithm
        '''
        self.t = 0
        self.initialize()
        self.evaluate()
        best = np.max(self.fitness)
        bestIndex = np.argmax(self.fitness)
        self.best = copy.deepcopy(self.population[bestIndex])
        self.avefitness = np.mean(self.fitness)
        self.maxfitness = np.max(self.fitness)

        self.trace[self.t, 0] =  self.best.fitness
        self.trace[self.t, 1] =  self.avefitness
        self.trace[self.t, 2] =  self.maxfitness
        print("Generation %d: optimal function value is: %f; average function value is %f;max function value is %f"% (
            self.t, self.trace[self.t, 0], self.trace[self.t, 1],self.trace[self.t, 2]))
        while (self.t < self.MAXGEN - 1):
            self.t += 1
            self.selectionOperation()
            self.crossoverOperation()
            self.mutationOperation()
            self.evaluate()
            best = np.max(self.fitness)
            bestIndex = np.argmax(self.fitness)
            if best > self.best.fitness:
                self.best = copy.deepcopy(self.population[bestIndex])
            self.avefitness = np.mean(self.fitness)
            self.maxfitness = np.max(self.fitness)

            self.trace[self.t, 0] =  self.best.fitness
            self.trace[self.t, 1] = self.avefitness
            self.trace[self.t, 2] =  self.maxfitness
            print("Generation %d: optimal function value is: %f; average function value is %f;max function value is %f"% (
            self.t, self.trace[self.t, 0], self.trace[self.t, 1],self.trace[self.t, 2]))

        print("Optimal function value is: %f; " %
              self.trace[self.t, 0])
        print ("Optimal solution is:")
        print (self.best.chrom)
        self.printResult()

    def selectionOperation(self):
        '''
        selection operation for Genetic Algorithm
        '''
        newpop = []
        totalFitness = np.sum(self.fitness)
        accuFitness = np.zeros((self.sizepop, 1))

        sum1 = 0.
        for i in range(0, self.sizepop):
            accuFitness[i] = sum1 + self.fitness[i] / totalFitness
            sum1 = accuFitness[i]

        for i in range(0, self.sizepop):
            r = random.random()
            idx = 0
            for j in range(0, self.sizepop - 1):
                if j == 0 and r < accuFitness[j]:
                    idx = 0
                    break
                elif r >= accuFitness[j] and r < accuFitness[j + 1]:
                    idx = j + 1
                    break
            newpop.append(self.population[idx])
        self.population = newpop

    def crossoverOperation(self):
        '''
        crossover operation for genetic algorithm
        '''
        newpop = []
        for i in range(0, self.sizepop, 2):
            idx1 = random.randint(0, self.sizepop - 1)
            idx2 = random.randint(0, self.sizepop - 1)
            while idx2 == idx1:
                idx2 = random.randint(0, self.sizepop - 1)
            newpop.append(copy.deepcopy(self.population[idx1]))
            newpop.append(copy.deepcopy(self.population[idx2]))
            r = random.random()
            if r < self.params[0]:
                crossPos = random.randint(1, self.vardim - 1)
                for j in range(crossPos, self.vardim):
                    newpop[i].chrom[j] = newpop[i].chrom[
                        j] * self.params[2] + (1 - self.params[2]) * newpop[i + 1].chrom[j]
                    newpop[i + 1].chrom[j] = newpop[i + 1].chrom[j] * self.params[2] + \
                        (1 - self.params[2]) * newpop[i].chrom[j]
        self.population = newpop

    def mutationOperation(self):
        '''
        mutation operation for genetic algorithm
        '''
        newpop = []
        for i in range(0, self.sizepop):
            newpop.append(copy.deepcopy(self.population[i]))
            r = random.random()
            if r < self.params[1]:
                mutatePos = random.randint(0, self.vardim - 1)
                theta = random.random()
                if theta > 0.5:
                    newpop[i].chrom[mutatePos] = newpop[i].chrom[
                        mutatePos] - (newpop[i].chrom[mutatePos] - self.bound[0, mutatePos]) * (1 - random.random() ** (1 - self.t / self.MAXGEN))
                else:
                    newpop[i].chrom[mutatePos] = newpop[i].chrom[
                        mutatePos] + (self.bound[1, mutatePos] - newpop[i].chrom[mutatePos]) * (1 - random.random() ** (1 - self.t / self.MAXGEN))
        self.population = newpop

    def printResult(self):
        '''
        plot the result of the genetic algorithm
        '''
        x = np.arange(0, self.MAXGEN)
        y1 = self.trace[:, 0]
        y2 = self.trace[:, 1]
        y3 = self.trace[:, 2]
        #plt.plot(x, y1, 'r', label='optimal value')
        plt.plot(x, y2, 'g', label='average value')
        plt.plot(x, y3, 'b', label='max value')
        fig = plt.gcf()
        fig.set_size_inches(18.5, 10.5)
        plt.xlabel("GENS")
        plt.ylabel("R2")
        plt.title("GA")
        plt.legend()
        plt.show()
开跑开跑!
if __name__ == "__main__":
   bound = np.array([[0,0,0],[10,2,100]])
   ga = GeneticAlgorithm(10, 3, bound, 20, [0.9, 0.1, 0.5])
   ga.solve()
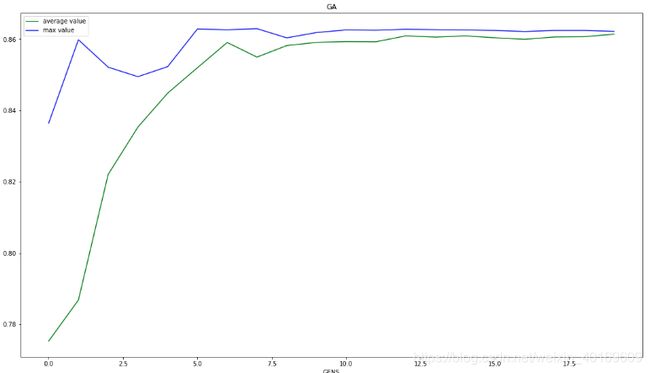
结果:
图不是很好看,GA确实容易陷入局部极值。
c、e、g等与[ 9.93055626 0.28102442 24.58580654]
6.融合GA-SVR模型
from sklearn.svm import SVR
import matplotlib.pyplot as plt
start1=time.time()
model_svr = SVR(C=9.93055626,epsilon=0.28102442,gamma=24.58580654)
model_svr.fit(feature_train,target_train)
predict_results1=model_svr.predict(feature_test)
end1=time.time()

plt.plot(target_test)#测试数组
plt.plot(predict_results1)#测试数组
plt.legend(['True','SVR'])
fig = plt.gcf()
fig.set_size_inches(18.5, 10.5)
plt.title("SVR")  # 标题
plt.show()
print("EVS:",explained_variance_score(target_test,predict_results1))
print("R2:",metrics.r2_score(target_test,predict_results1))
print("Time:",end1-start1)
时间虽然增大,但R方和EVS均有较大提升。
