基于企鹅数据集的决策树实战
#下载需要用到的数据集
!wget https://tianchi-media.oss-cn-beijing.aliyuncs.com/DSW/6tree/penguins_raw.csv
Step1:函数库导入
##  基础函数库
import numpy as np
import pandas as pd

## 绘图函数库
import matplotlib.pyplot as plt
import seaborn as sns
Step2:数据读取/载入
## 我们利用Pandas自带的read_csv函数读取并转化为DataFrame格式

data = pd.read_csv('./penguins_raw.csv')
## 为了方便我们仅选取四个简单的特征,有兴趣的同学可以研究下其他特征的含义以及使用方法
data = data[['Species','Culmen Length (mm)','Culmen Depth (mm)',
            'Flipper Length (mm)','Body Mass (g)']]
Step3:数据信息简单查看
## 利用.info()查看数据的整体信息
data.info()
## 进行简单的数据查看,我们可以利用 .head() 头部.tail()尾部
data.head()

这里我们发现数据中存在缺失值,我们可以使用相应的方法将其值补全
data = data.fillna(-1)
## 其对应的类别标签为'Adelie Penguin', 'Gentoo penguin', 'Chinstrap penguin'三种不同企鹅的类别。
data['Species'].unique()
## 利用value_counts函数查看每个类别数量
pd.Series(data['Species']).value_counts()
## 对于特征进行一些统计描述
data.describe()
Step4:可视化描述
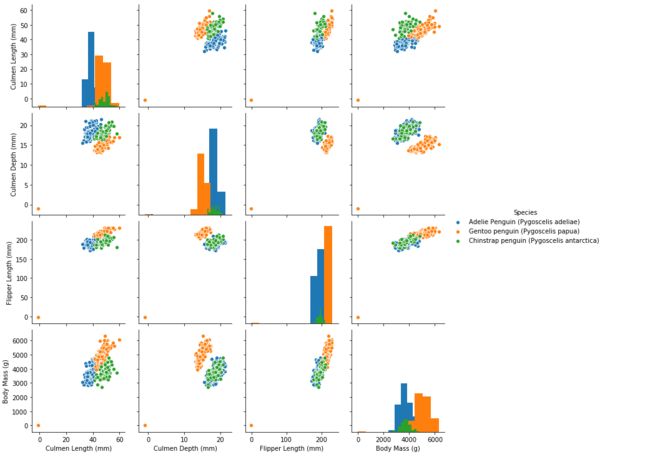
## 特征与标签组合的散点可视化
sns.pairplot(data=data, diag_kind='hist', hue= 'Species')
plt.show()
## 将分类变量转化成数字变量,方便后续计算
def trans(x):
    if x == data['Species'].unique()[0]:
        return 0
    if x == data['Species'].unique()[1]:
        return 1
    if x == data['Species'].unique()[2]:
        return 2

data['Species'] = data['Species'].apply(trans)
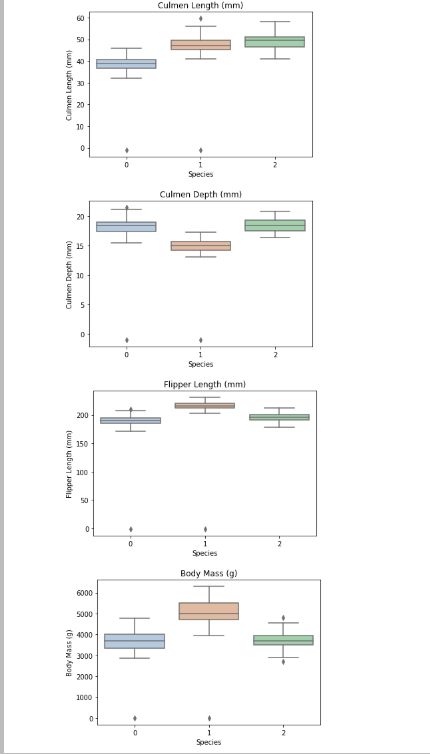
箱型图展示:
for col in data.columns:
    if col != 'Species':
        sns.boxplot(x='Species', y=col, saturation=0.5, palette='pastel', data=data)
        plt.title(col)
        plt.show()
Step5:利用 决策树模型 在二分类上 进行训练和预测
## 为了正确评估模型性能,将数据划分为训练集和测试集,并在训练集上训练模型,在测试集上验证模型性能。
from sklearn.model_selection import train_test_split

## 选择其类别为0和1的样本 (不包括类别为2的样本)
data_target_part = data[data['Species'].isin([0,1])][['Species']]
data_features_part = data[data['Species'].isin([0,1])][['Culmen Length (mm)','Culmen Depth (mm)',
            'Flipper Length (mm)','Body Mass (g)']]

## 测试集大小为20%, 80%/20%分
x_train, x_test, y_train, y_test = train_test_split(data_features_part, data_target_part, test_size = 0.2, random_state = 2020)

## 从sklearn中导入决策树模型
from sklearn.tree import DecisionTreeClassifier
from sklearn import tree
## 定义 决策树模型
clf = DecisionTreeClassifier(criterion='entropy')
# 在训练集上训练决策树模型
clf.fit(x_train, y_train)
## 在训练集和测试集上分布利用训练好的模型进行预测
train_predict = clf.predict(x_train)
test_predict = clf.predict(x_test)
from sklearn import metrics

## 利用accuracy(准确度)【预测正确的样本数目占总预测样本数目的比例】评估模型效果
print('The accuracy of the Logistic Regression is:',metrics.accuracy_score(y_train,train_predict))
print('The accuracy of the Logistic Regression is:',metrics.accuracy_score(y_test,test_predict))

## 查看混淆矩阵 (预测值和真实值的各类情况统计矩阵)
confusion_matrix_result = metrics.confusion_matrix(test_predict,y_test)
print('The confusion matrix result:\n',confusion_matrix_result)

# 利用热力图对于结果进行可视化
plt.figure(figsize=(8, 6))
sns.heatmap(confusion_matrix_result, annot=True, cmap='Blues')
plt.xlabel('Predicted labels')
plt.ylabel('True labels')
plt.show()
Step6:利用 决策树模型 在三分类(多分类)上 进行训练和预测
## 测试集大小为20%, 80%/20%分
x_train, x_test, y_train, y_test = train_test_split(data[['Culmen Length (mm)','Culmen Depth (mm)',
            'Flipper Length (mm)','Body Mass (g)']], data[['Species']], test_size = 0.2, random_state = 2020)
## 定义 决策树模型
clf = DecisionTreeClassifier()
# 在训练集上训练决策树模型
clf.fit(x_train, y_train)
## 在训练集和测试集上分布利用训练好的模型进行预测
train_predict = clf.predict(x_train)
test_predict = clf.predict(x_test)

## 由于决策树模型是概率预测模型(前文介绍的 p = p(y=1|x,\theta)),所有我们可以利用 predict_proba 函数预测其概率
train_predict_proba = clf.predict_proba(x_train)
test_predict_proba = clf.predict_proba(x_test)

print('The test predict Probability of each class:\n',test_predict_proba)
## 其中第一列代表预测为0类的概率,第二列代表预测为1类的概率,第三列代表预测为2类的概率。

## 利用accuracy(准确度)【预测正确的样本数目占总预测样本数目的比例】评估模型效果
print('The accuracy of the Logistic Regression is:',metrics.accuracy_score(y_train,train_predict))
print('The accuracy of the Logistic Regression is:',metrics.accuracy_score(y_test,test_predict))
## 查看混淆矩阵
confusion_matrix_result = metrics.confusion_matrix(test_predict,y_test)
print('The confusion matrix result:\n',confusion_matrix_result)

# 利用热力图对于结果进行可视化
plt.figure(figsize=(8, 6))
sns.heatmap(confusion_matrix_result, annot=True, cmap='Blues')
plt.xlabel('Predicted labels')
plt.ylabel('True labels')
plt.show()


