使用核SVM对鸢尾花进行分类
用高斯核SVM拟合异或数据集
使用核SVM可以很容易地解决非线性可分问题,代码引自《python机器学习》。
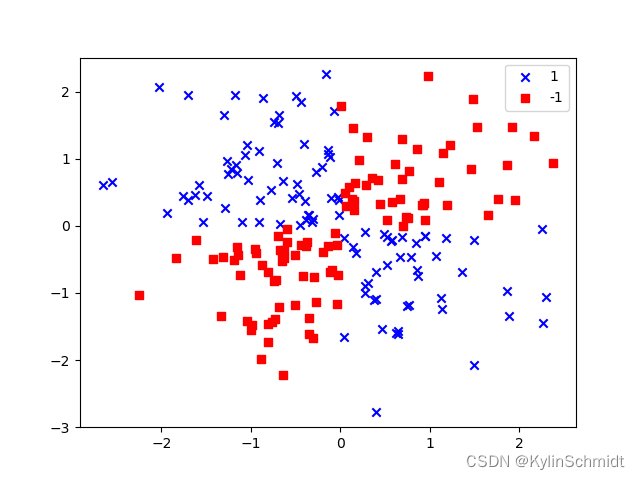
一种非线性可分的数据集可以通过如下代码实现:
np.random.seed(0)
X_xor = np.random.randn(200, 2)# 返回200*2的array,数据符合标准正态分布
y_xor = np.logical_xor(X_xor[:, 0] > 0, X_xor[:, 1] > 0)# 异或操作,返回0和1
y_xor = np.where(y_xor, 1, -1) #np.where(condition, x, y)满足condition返回x,不满足则返回y,将其划分为1和-1两类
plt.scatter(X_xor[y_xor == 1, 0], X_xor[y_xor == 1, 1], c='b', marker='x', label='1')
plt.scatter(X_xor[y_xor == -1, 0], X_xor[y_xor == -1, 1], c='r', marker='s', label='-1')
plt.ylim(-3.0) #标准正态分布在在[-3,3]内的概率非常接近1
plt.legend()
plt.show()
该数据集如下图所示:

可以看出数据在四个象限内的区别
核方法处理非线性可分的数据的基本理念就是通过映射 ϕ \phi ϕ将样本的原始特征映射到一个使样本线性可分的高维空间,使得我们可以通过线性超平面进行分割(也就是用多项式假设函数去拟合决策边界),再在该空间中训练SVM。
然而,构建新的特征空间带来较大的计算成本,特别是在处理高维数据时,在实践中,我们就需要用到核技巧方法,我们不会过多关注SVM训练中所需解决的二次规划问题,而是将点积 x ( i ) T x ( j ) x^{(i)T}x^{(j)} x(i)Tx(j)映射成 ϕ ( x ( i ) ) T ϕ ( x ( j ) ) \phi(x^{(i)})^T\phi(x^{(j)}) ϕ(x(i))Tϕ(x(j)),即核函数:
k ( x i , x j ) = ϕ ( x ( i ) ) T ϕ ( x ( j ) ) k(\bm{x}^{i},\bm{x}^{j})=\phi(\bm{x}^{(i)})^T\phi(\bm{x}^{(j)}) k(xi,xj)=ϕ(x(i))Tϕ(x(j))
最广为使用的核函数为径向基核函数(Radial Basis Function kernel, RBF kernel)或高斯核(Gaussian kernel):
k ( x i , x j ) = exp ( − ∣ ∣ x i − x j ∣ ∣ 2 2 σ 2 ) k(\bm{x}^{i},\bm{x}^{j})=\exp(-\frac{||\bm{x}^{i}-\bm{x}^{j}||^2}{2\sigma^2}) k(xi,xj)=exp(−2σ2∣∣xi−xj∣∣2)
令 γ = 1 2 σ 2 \gamma=\frac{1}{2\sigma^2} γ=2σ21,该值较小则SVM的决策边界就会较为宽松。
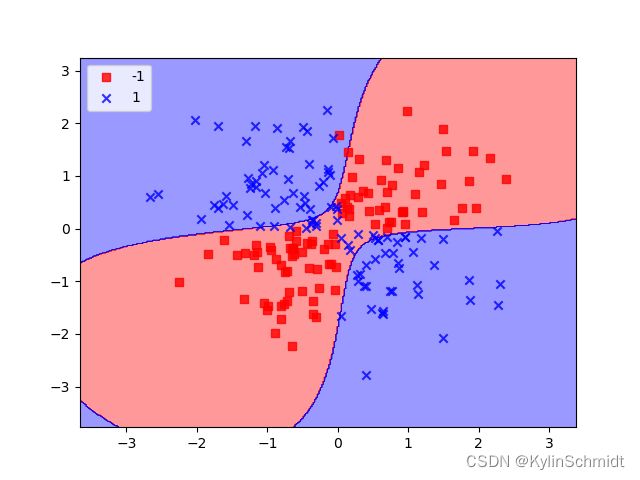
用如下代码用高斯核函数对上述异或数据集进行拟合:
svm = SVC(kernel='rbf', random_state=0, gamma=0.20, C=1.0)# 使用径向基函数核
svm.fit(X_xor, y_xor)
plot_decision_regions(X_xor, y_xor, classifier=svm)
plt.legend(loc='upper left')
plt.show()
用高斯核SVM对鸢尾花进行分类
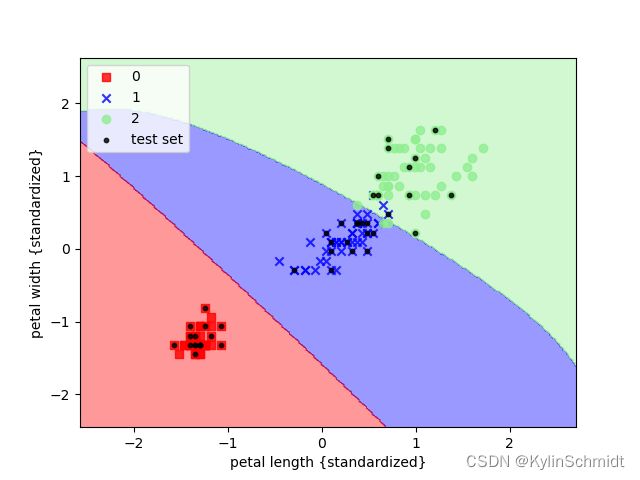
这类方法同样可以应用到鸢尾花的分类上,代码如下:
from sklearn import datasets
from sklearn.model_selection import train_test_split
from sklearn.preprocessing import StandardScaler
from sklearn.svm import SVC
from matplotlib.colors import ListedColormap
import matplotlib.pyplot as plt
import numpy as np
iris = datasets.load_iris()
X = iris.data[:, [2, 3]]
y = iris.target
X_train, X_test, y_train, y_test = train_test_split(X,y,test_size=0.3,random_state=0)

sc = StandardScaler()
sc.fit(X_train)
X_train_std = sc.transform(X_train)
X_test_std: object = sc.transform(X_test)


def plot_decision_regions(X, y, classifier, test_idx=None, resolution=0.02):
    markers = ('s', 'x', 'o', '^', 'v')
    colors = ('red', 'blue', 'lightgreen', 'gray', 'cyan')
    cmap = ListedColormap(colors[:len(np.unique(y))])
    x1_min, x1_max = X[:, 0].min() - 1, X[:, 0].max() + 1
    x2_min, x2_max = X[:, 1].min() - 1, X[:, 1].max() + 1
    xx1, xx2 = np.meshgrid(np.arange(x1_min, x1_max, resolution),
                           np.arange(x2_min, x2_max, resolution))
    Z = classifier.predict(np.array([xx1.ravel(), xx2.ravel()]).T)
    Z = Z.reshape(xx1.shape)
    plt.contourf(xx1, xx2, Z, alpha=0.4, cmap=cmap)
    plt.xlim(xx1.min(), xx1.max())
    plt.ylim = (xx2.min(), xx2.max())
    X_test, y_test = X[test_idx, :], y[test_idx]
    for idx, cl in enumerate(np.unique(y)):
        plt.scatter(x=X[y == cl, 0], y=X[y == cl, 1], alpha=0.8, c=cmap(idx), marker=markers[idx], label=cl)
    if test_idx:
        X_test, y_test = X[test_idx, :], y[test_idx]
        plt.scatter(X_test[:, 0], X_test[:, 1], c='black', alpha=0.8, linewidths=1, marker='o', s=10, label='test set')


X_combined_std = np.vstack((X_train_std, X_test_std))
y_combined = np.hstack((y_train, y_test))
svm = SVC(kernel='rbf', random_state=0, gamma=0.20, C=1.0)# 使用径向基函数核
svm.fit(X_train_std, y_train)
plot_decision_regions(X_combined_std, y_combined, classifier=svm, test_idx=range(105,150))
plt.xlabel('petal length {standardized}')
plt.ylabel('petal width {standardized}')
plt.legend(loc='upper left')
plt.show()

