商务图表案例——仿经济学人分组漏斗图~
今天看到一个看着挺养眼的经济学人图表案例,于是职业病爆发了,用ggplot2按照自己的思路写了一遍。现在把代码思路分享给大家!
加载包:
library("ggplot2")
library("tidyr")
library("magrittr")
library("dplyr")
library("showtext")
library("Cairo")
font_add("myfont","msyh.ttc")
构造原始数据:
mydata<-data.frame(
  index=c("all jobs","jobs at the same level","jobs at the same level\nand the same company","jobs at the same level,\ncompany and function"),
  Britain=c(28.6,9.3,2.6,0.8),
  France=c(17.0,4.0,3.1,2.7),
  Germany=c(15.1,3.6,3.1,3.0)
)
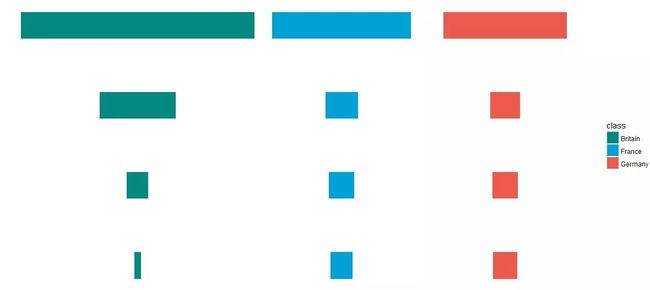
构造条形图数据
rect_data<-mydata %>% gather(class,Value,-index)
rect_data<-within(rect_data,{
  x_start=NA
  x_end=NA
  y_start=NA
  y_end=NA
  x_start[class=="Britain"]=35-Value[class=="Britain"]/2
  x_end[class=="Britain"]  =35+Value[class=="Britain"]/2
  x_start[class=="France"]=60-Value[class=="France"]/2
  x_end[class=="France"]  =60+Value[class=="France"]/2
  x_start[class=="Germany"]=80-Value[class=="Germany"]/2
  x_end[class=="Germany"]  =80+Value[class=="Germany"]/2
  y_start=(c(50,35,20,5) -2.5) %>% rep(.,3)
  y_end  =(c(50,35,20,5) +2.5) %>% rep(.,3)
})
条形图图形:
paltte1<-c("#038980","#00A1D7","#ED594D")
ggplot()+
  geom_rect(data=rect_data,aes(xmin=x_start,xmax=x_end,ymin=y_start,ymax=y_end,fill=class))+
  scale_fill_manual(values=paltte1)+
  theme_void()
构造连接带多边形数据
这里连接带数据构造是非常复杂的,特别是12个多边形,每一个多边形的四个拐点坐标均需要一一构造,并且先按照多边形分组,然后按照三个国家分组。
你最好亲自运行一下,或许才能看明白我以下代码中所写的那个数字向量的顺序是什么意思!
ploygon=function(mydata) {
  Bartain=mydata %>% filter(class=="Britain") %>% select(x_start,x_end) %>% as.matrix(.,nrow=4) %>% as.numeric() %>% .[c(1,5,6,2,2,6,7,3,3,7,8,4)]
  France =mydata %>% filter(class=="France")  %>% select(x_start,x_end) %>% as.matrix(.,nrow=4) %>% as.numeric() %>% .[c(1,5,6,2,2,6,7,3,3,7,8,4)]
  Germany=mydata %>% filter(class=="Germany") %>% select(x_start,x_end) %>% as.matrix(.,nrow=4) %>% as.numeric() %>% .[c(1,5,6,2,2,6,7,3,3,7,8,4)]
  long=c(Bartain,France,Germany)
  lat= mydata %>% .[1:4,] %>% select(y_end,y_start) %>% as.matrix(.,nrow=4) %>% as.numeric() %>% .[c(5,5,2,2,6,6,3,3,7,7,4,4)] %>% rep(3)
  ploygon=rep(LETTERS[1:9],each=4)
  label=rep(c("Britain","France","Germany"),each=12)
  return(data.frame(long,lat,ploygon,label))
  }
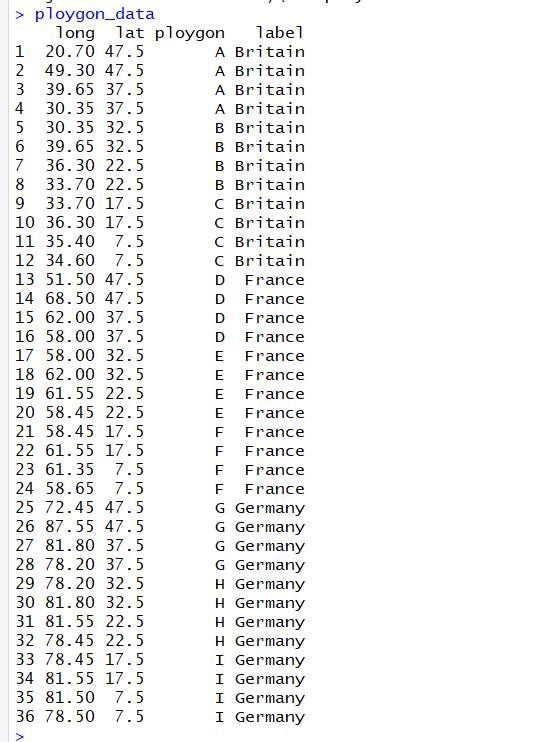
ploygon_data=ploygon(rect_data)
连接带图形可视化
paltte2<-c("#7EB9B5","#77CCEB","#F7AA8C")
ggplot()+
  geom_polygon(data=ploygon_data,aes(x=long,y=lat,group=ploygon,fill=label))+
  scale_fill_manual(values=paltte2)+
theme_void()
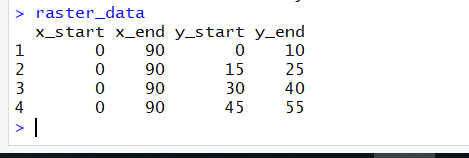
背影底纹多边形数据
raster_data<-data.frame(
  x_start=0,
  x_end =90,
  y_start=c(0,15,30,45),
  y_end=c(10,25,40,55)
)
底纹图形可视化
ggplot()+
 geom_rect(data=raster_data,aes(xmin=x_start,xmax=x_end,ymin=y_start,ymax=y_end),fill="#E8F2F4")+
theme_void()
图形汇总:
ggplot()+
geom_rect(data=raster_data,aes(xmin=x_start,xmax=x_end,ymin=y_start,ymax=y_end),fill="#E8F2F4")+
  geom_rect(data=rect_data,aes(xmin=x_start,xmax=x_end,ymin=y_start,ymax=y_end,fill=class))+
  geom_polygon(data=ploygon_data,aes(x=long,y=lat,group=ploygon,fill=label))+
  scale_fill_manual(values=paltte1)+
  scale_fill_manual(values=paltte2)+
theme_void()####Scale for 'fill' is already present. Adding another scale for 'fill', which will replace the existing scale.可以看到,ggplot2图形对象禁止同时在一个图形中使用两个或者两个以上的标度,否则最后的标度将会覆盖前面的同名标度。
这个问题已经困惑了我将近一年了,最初的疑惑是在这篇文章里:
R语言可视化——多图层叠加(离散颜色填充与气泡图综合运用)
好在如果是多边形和气泡图同时使用颜色填充的时候,我们可以通过将气泡图使用1~5号仅有colour属性的点进行映射来规避颜色标度冲突,因为scale_colour_xxx和scale_fill_xxx是两个不同属性的标度。这个问题算是被我迂回的解决了!
数据地图多图层对象的颜色标度重叠问题解决方案
但是针对本例而言,这个问题没法直接解决,因为我要填充的两个图层都是fill属性,但是并不是一点儿也没有解决办法,我将其中一个图层(polygon)的颜色类别变量因子拆开成了三个图层分别映射,虽然费事了,暂时没有办法,这是唯一的办法。
CairoPNG(file="E:/funnel_chart.png",width=1200,height=700)
showtext.begin()
ggplot()+
  #底纹图层
  geom_rect(data=raster_data,aes(xmin=x_start,xmax=x_end,ymin=y_start,ymax=y_end),fill="#E8F2F4")+
  #条形图图层
  geom_rect(data=rect_data,aes(xmin=x_start,xmax=x_end,ymin=y_start,ymax=y_end,fill=class),show.legend = FALSE)+
  #三个图层共同描绘条形图之间的连接带
  geom_polygon(data=ploygon_data[ploygon_data$label=="Britain",],aes(x=long,y=lat,group=ploygon),fill=paltte2[1])+
  geom_polygon(data=ploygon_data[ploygon_data$label=="France",], aes(x=long,y=lat,group=ploygon),fill=paltte2[2])+
  geom_polygon(data=ploygon_data[ploygon_data$label=="Germany",], aes(x=long,y=lat,group=ploygon),fill=paltte2[3])+
  #左侧解释性文本
  geom_text(data=NULL,aes(x=0.5,y=c(5,20,35,50),label=rev(mydata$index)),hjust=0,size=6.5,lineheight=.8)+
  #国家分类标签
  geom_text(data=NULL,aes(x=c(35,60,80),y=57.5,label=c("Britain","France","German")),hjust=.5,size=8)+
  #数据标签
  geom_text(data=rect_data,aes(x=x_start+(x_end-x_start)/2,y=y_start+(y_end-y_start)/2,label=Value),size=6,colour="white")+
  scale_fill_manual(values=paltte1)+
  annotate("text", x = 6, y = 57.5, label = "Pay gap for:",size=9)+
  labs(
    title="like-for-like",
    subtitle="Pay gap between women and men,2016,% of men's wages*",
    caption="Sour:Korn Ferry"
  )+
  xlim(0,90)+
  ylim(0,60)+
  theme_void(base_size=20,base_family = "myfont") %+replace%
  theme(
    plot.title = element_text(hjust=0.045,lineheight=3,size=32),
    plot.subtitle = element_text(hjust = 0.08,lineheight=3),
    plot.caption = element_text(hjust=0.05),
    plot.margin = unit(c(1,0,1,0), "lines")
  )
showtext.end()
dev.off()
在线课程请点击文末原文链接:
往期案例数据请移步本人GitHub:
https://github.com/ljtyduyu/DataWarehouse/tree/master/File
公众号后台回复关键字即可学习
回复 R R语言快速入门免费视频
回复 统计 统计方法及其在R中的实现
回复 用户画像 民生银行客户画像搭建与应用
回复 大数据 大数据系列免费视频教程
回复 可视化 利用R语言做数据可视化
回复 数据挖掘 数据挖掘算法原理解释与应用
回复 机器学习 R&Python机器学习入门


