基于决策树的分类预测
1.决策树的介绍
决策树(decision tree)是一种基本的分类与回归的方法,作为最基础、最常见的有监督学习模型,常被用于解决分类回归问题。本文主要讨论用于分类的决策树。决策树的核心思想是基于树结构对数据进行划分,这种思想是人类处理问题时的本能方法。
比如:你母亲要给你介绍男朋友,是这么来对话的:
女儿:多大年纪了?
母亲:26。
女儿:长的帅不帅?
母亲:挺帅的。
女儿:收入高不?
母亲:不算很高,中等情况。
女儿:是公务员不?
母亲:是,在税务局上班呢。
女儿:那好,我去见见。
于是你在脑袋里面就有了下面这张图:
作为女孩的你在决策过程就是典型的分类树决策。相当于通过年龄、长相、收入和是否公务员对将男人分为两个类别:见和不见。
2.决策树的优缺点
决策树的主要优点:
- 具有很好的解释性,模型可以生成可以理解的规则。
- 可以发现特征的重要程度。
- 模型的计算复杂度较低。
决策树的主要缺点:
- 模型容易过拟合,需要采用减枝技术处理。
- 不能很好利用连续型特征。
- 预测能力有限,无法达到其他强监督模型效果。
- 方差较高,数据分布的轻微改变很容易造成树结构完全不同。
3. 决策树的应用
由于决策树模型中自变量与因变量的非线性关系以及决策树简单的计算方法,使得它成为集成学习中最为广泛使 用的基模型。梯度提升树(GBDT),XGBoost以及LightGBM等集成模型都采用了决策树作为基模型,在广告计算、 CTR预估、金融风控等领域大放异彩,成为当今与神经网络相提并论的复杂模型,更是数据挖掘比赛中的常客。 同时决策树在一些需要明确可解释甚至提取分类规则的场景中被广泛应用,而其他机器学习模型在这一点很难做 到。例如在医疗辅助系统中,为了方便专业人员发现错误,常常将决策树算法用于辅助病症检测。
4. 基于决策树的分类预测实战
4.1 库函数导入
## 基础函数库
import numpy as np
## 导入画图库
import matplotlib.pyplot as plt
import seaborn as sns
## 导入决策树模型函数
from sklearn.tree import DecisionTreeClassifier
from sklearn import tree
4.2 模型训练
##演示LogisticRegression分类
## 构造数据集
x_fearures = np.array([[-1, -2], [-2, -1], [-3, -2], [1, 3], [2, 1], [3, 2]])
y_label = np.array([0, 1, 0, 1, 0, 1])
## 调用逻辑回归模型
tree_clf = DecisionTreeClassifier()
## 用逻辑回归模型拟合构造的数据集
tree_clf = tree_clf.fit(x_fearures, y_label)
4.3 数据和模型可视化
## 可视化构造的数据样本点
plt.figure()
plt.scatter(x_fearures[:,0],x_fearures[:,1], c=y_label, s=50, cmap='viridis')
plt.title('Dataset')
plt.show()
## 可视化决策树
import graphviz
dot_data = tree.export_graphviz(tree_clf, out_file=None)
graph = graphviz.Source(dot_data)
graph.render("pengunis")
4.4 模型预测
## 创建新样本
x_fearures_new1 = np.array([[0, -1]])
x_fearures_new2 = np.array([[2, 1]])
## 在训练集和测试集上分布利用训练好的模型进行预测
y_label_new1_predict = tree_clf.predict(x_fearures_new1)
y_label_new2_predict = tree_clf.predict(x_fearures_new2)
print('The New point 1 predict class:\n',y_label_new1_predict)
print('The New point 2 predict class:\n',y_label_new2_predict)

#输出结果
#The New point 1 predict class:[1]
#The New point 2 predict class:[0]
5. 基于企鹅数据集的决策树实战
5.1 库函数导入
基础的函数库包括:numpy (Python进行科学计算的基础软件包), pandas(pandas是一种快速,强大,灵活且易于使用的开源数据分析和处理工具),matplotlib和seaborn绘图。
## 基础函数库
import numpy as np
import pandas as pd
## 绘图函数库
import matplotlib.pyplot as plt
import seaborn as sns
5.2 数据读取/载入
本次我们选择企鹅数据(palmerpenguins)进行方法的尝试训练,该数据集一共包含8个变量,其中7个特征变量,1 个目标分类变量。目标变量为 企鹅的类别 其都属于企鹅类的三个亚属,分别是(Adélie, Chinstrap and Gentoo)。包含的三种种企鹅的七个特征,分别是所在岛屿,嘴巴长度,嘴巴深度,脚蹼长度,身体体积,性别以及年龄。
| 变量 | 描述 |
|---|---|
| species | a factor denoting penguin species |
| island | a factor denoting island in Palmer Archipelago, Antarctica |
| bill_length_mm | a number denoting bill length |
| bill_depth_mm | a number denoting bill depth |
| flipper_length_mm | an integer denoting flipper length |
| body_mass_g | an integer denoting body mass P |
| sex | a factor denoting penguin sex |
| year | an integer denoting the study year |
# 我们利用Pandas自带的read_csv函数读取并转化为DataFrame格式
data = pd.read_csv('penguins_raw.csv')
# 选取四个简单的特征
data = data[['Species', 'Culmen Length (mm)', 'Culmen Depth (mm)',
             'Flipper Length (mm)', 'Body Mass (g)']]
5.3 数据信息简单查看
# 利用.info()查看数据的整体信息
data.info()
/"""
RangeIndex: 344 entries, 0 to 343
Data columns (total 5 columns):
Species 344 non-null object
Culmen Length (mm) 342 non-null float64
Culmen Depth (mm) 342 non-null float64
Flipper Length (mm) 342 non-null float64
Body Mass (g) 342 non-null float64
dtypes: float64(4), object(1)
memory usage: 13.5+ KB
""" /
# 进行简单的数据查看,我们可以利用 .head() 头部.tail()尾部
print(data.head())
          Species Culmen Length (mm)   Culmen Depth (mm)  Flipper Length (mm)  Body Mass (g)
Adelie Penguin (Pygoscelis adeliae)   39.1       18.7   		181.0                3750.0
Adelie Penguin (Pygoscelis adeliae)   39.5       17.4   		186.0                3800.0
Adelie Penguin (Pygoscelis adeliae)   40.3       18.0   		195.0                3250.0
Adelie Penguin (Pygoscelis adeliae)    NaN        NaN   		  NaN                   NaN
Adelie Penguin (Pygoscelis adeliae)   36.7       19.3   		193.0                3450.0
一般的我们认为NaN在数据集中代表了缺失值,可能是数据采集或处理时产生的 一种错误。这里采用-1将缺失值进行填补,还有其他例如“中位数填补、平均数填补”的缺失值处理方法。
data = data.fillna(-1)
# 对应的类别标签为'Adelie Penguin', 'Gentoo penguin', 'Chinstrap penguin'三种不同企鹅的类别。
print(data['Species'].unique())

#['Adelie Penguin (Pygoscelis adeliae)' 'Gentoo penguin (Pygoscelis papua)'
 #'Chinstrap penguin (Pygoscelis antarctica)']

# 利用value_counts函数查看每个类别数量
print(pd.Series(data['Species']).value_counts())
/"""
Adelie Penguin (Pygoscelis adeliae)          152
Gentoo penguin (Pygoscelis papua)            124
Chinstrap penguin (Pygoscelis antarctica)     68
Name: Species, dtype: int64
"""/

# 对于特征进行一些统计描述
print(data.describe())
/"""
       Culmen Length (mm)  Culmen Depth (mm)  Flipper Length (mm)  Body Mass (g)
count          344.000000         344.000000           344.000000     344.000000
mean            43.660756          17.045640           199.741279    4177.319767
std              6.428957           2.405614            20.806759     861.263227
min             -1.000000          -1.000000            -1.000000      -1.000000
25%             39.200000          15.500000           190.000000    3550.000000
50%             44.250000          17.300000           197.000000    4025.000000
75%             48.500000          18.700000           213.000000    4750.000000
max             59.600000          21.500000           231.000000    6300.000000
"""/
5.4 可视化描述
# 特征与标签组合的散点可视化
sns.pairplot(data=data, diag_kind='hist', hue='Species')
plt.show()
从上图可以发现,在2D情况下不同的特征组合对于不同类别的企鹅的散点分布以及大概的区分能力。
为了方便我们将标签转化为数字
| 企鹅种类 | 对应标签 |
|---|---|
| 'Adelie Penguin (Pygoscelis adeliae) | 0 |
| Gentoo penguin (Pygoscelis papua) | 1 |
| Chinstrap penguin (Pygoscelis antarctica) | 2 |
def trans(x):
    if x == data['Species'].unique()[0]:
        return 0
    if x == data['Species'].unique()[1]:
        return 1
    if x == data['Species'].unique()[2]:
        return 2


data['Species'] = data['Species'].apply(trans)
for col in data.columns:
    if col != 'Species':
        sns.boxplot(x='Species', y=col, saturation=0.5, palette='pastel', data=data)
        plt.title(col)
        plt.show()
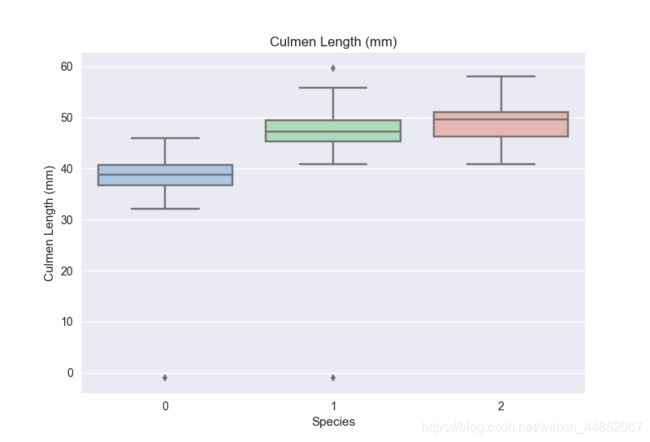
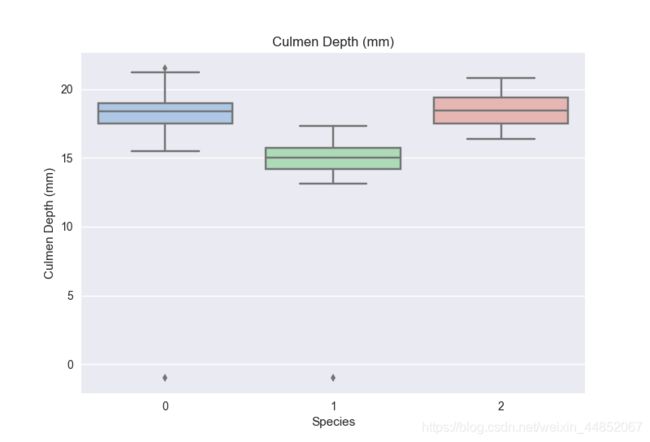
从上述的箱型图,可以得到不同类别的样本在不同特征上的分布差异情况。
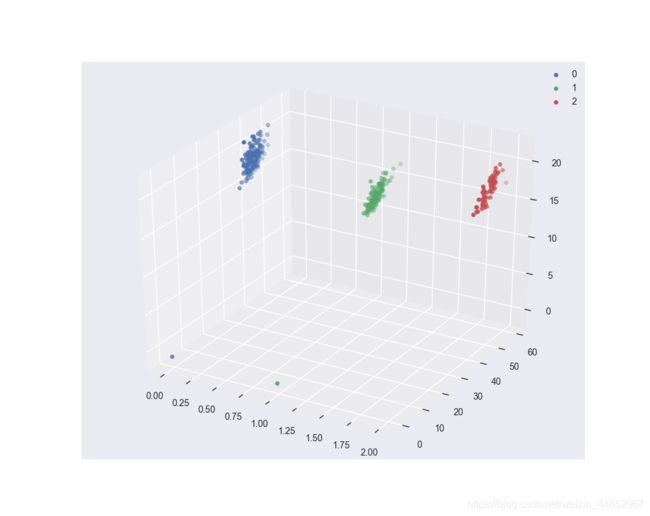
# 选取其前三个特征绘制三维散点图
from mpl_toolkits.mplot3d import Axes3D

fig = plt.figure(figsize=(10, 8))
ax = fig.add_subplot(111, projection='3d')
data_class0 = data[data['Species'] == 0].values
data_class1 = data[data['Species'] == 1].values
data_class2 = data[data['Species'] == 2].values
# 'setosa'(0), 'versicolor'(1), 'virginica'(2)
ax.scatter(data_class0[:, 0], data_class0[:, 1],
           data_class0[:, 2], label=data['Species'].unique()[0])
ax.scatter(data_class1[:, 0], data_class1[:, 1],
           data_class1[:, 2], label=data['Species'].unique()[1])
ax.scatter(data_class2[:, 0], data_class2[:, 1],
           data_class2[:, 2], label=data['Species'].unique()[2])
plt.legend()
plt.show()
5.5 利用 决策树模型 在二分类上 进行训练和预测
# 为了正确评估模型性能,将数据划分为训练集和测试集,并在训练集上训练模型,在测试集上验证模型性能。
from sklearn.model_selection import train_test_split

# 选择其类别为0和1的样本 (不包括类别为2的样本)
data_target_part = data[data['Species'].isin([0, 1])][['Species']]
data_features_part = data[data['Species'].isin([0, 1])][['Culmen Length (mm)',
                                                         'Culmen Depth (mm)',
                                                         'Flipper Length (mm)',
                                                         'Body Mass (g)']]
# 测试集大小为20%, 80%/20%分
x_train, x_test, y_train, y_test = train_test_split(data_features_part, data_target_part,
                                                    test_size=0.2, random_state=2020)

# 从sklearn库中导入决策树模型
from sklearn.tree import DecisionTreeClassifier
from sklearn import tree

# 定义 逻辑回归模型
clf = DecisionTreeClassifier(criterion='entropy')
# 在训练集上训练决策树模型
clf.fit(x_train, y_train)
print(clf)
/"""
DecisionTreeClassifier(class_weight=None, criterion='entropy', max_depth=None,
            max_features=None, max_leaf_nodes=None,
            min_impurity_decrease=0.0, min_impurity_split=None,
            min_samples_leaf=1, min_samples_split=2,
            min_weight_fraction_leaf=0.0, presort=False, random_state=None,
            splitter='best')
"""/
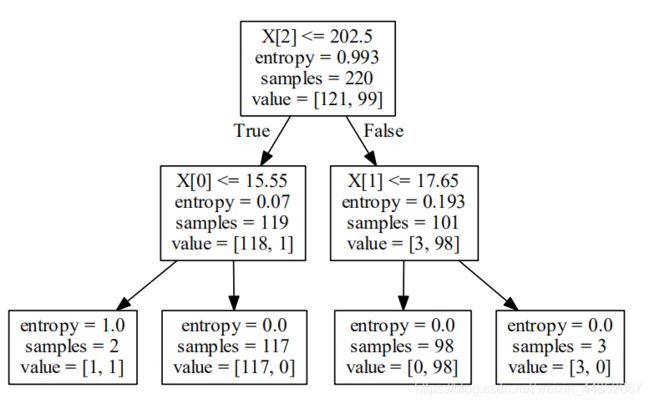
## 可视化
import graphviz
dot_data = tree.export_graphviz(clf, out_file=None)
graph = graphviz.Source(dot_data)
graph.render("penguins")
# 在训练集和测试集上分布利用训练好的模型进行预测
train_predict = clf.predict(x_train)
test_predict = clf.predict(x_test)
from sklearn import metrics

# 利用accuracy(准确度)【预测正确的样本数目占总预测样本数目的比例】评估模型效果
print('The accuracy of the Logistic Regressionis: ', metrics.accuracy_score(y_train, train_predict))
print('The accuracy of the Logistic Regressionis: ', metrics.accuracy_score(y_test, test_predict))
# 查看混淆矩阵 (预测值和真实值的各类情况统计矩阵)
confusion_matrix_result = metrics.confusion_matrix(test_predict, y_test)
print('The confusion matrix result:\n', confusion_matrix_result)
# 利用热力图对于结果进行可视化
plt.figure(figsize=(8, 6))
sns.heatmap(confusion_matrix_result, annot=True, cmap='Blues')
plt.xlabel('Predicted labels')
plt.ylabel('True labels')
plt.show()

/"""
The accuracy of the Logistic Regressionis:  0.995454545455
The accuracy of the Logistic Regressionis:  1.0
The confusion matrix result:
 [[31  0]
 [ 0 25]]
"""/
我们得到的准确率为1,说明所有的样本都分类正确。
5.6 利用 决策树模型 在三分类(多分类)上 进行训练和预测
# 测试集大小为20%, 80%/20%分
x_train, x_test, y_train, y_test = train_test_split(
  data[['Culmen Length (mm)', 'Culmen Depth (mm)','Flipper Length (mm)', 'Body Mass (g)']], 	   data[['Species']],test_size=0.2, random_state=2020)
# 定义 逻辑回归模型
clf = DecisionTreeClassifier()
# 在训练集上训练逻辑回归模型
clf.fit(x_train, y_train)
print(clf)

/"""
DecisionTreeClassifier(class_weight=None, criterion='gini', max_depth=None,
            max_features=None, max_leaf_nodes=None,
            min_impurity_decrease=0.0, min_impurity_split=None,
            min_samples_leaf=1, min_samples_split=2,
            min_weight_fraction_leaf=0.0, presort=False, random_state=None,
            splitter='best')
"""/
# 在训练集和测试集上分布利用训练好的模型进行预测
train_predict = clf.predict(x_train)
test_predict = clf.predict(x_test)
# 由于逻辑回归模型是概率预测模型(前文介绍的 p = p(y=1|x,\theta)),所有我们可以利用predict_proba 函数预测其概率
train_predict_proba = clf.predict_proba(x_train)
test_predict_proba = clf.predict_proba(x_test)
print('The test predict Probability of each class:\n', test_predict_proba)
# 其中第一列代表预测为0类的概率,第二列代表预测为1类的概率,第三列代表预测为2类的概率。
# 利用accuracy(准确度)【预测正确的样本数目占总预测样本数目的比例】评估模型效果
print('The accuracy of the Logistic Regression is:', metrics.accuracy_score(y_train, train_predict))
print('The accuracy of the Logistic Regression is:', metrics.accuracy_score(y_test, test_predict))
/"""
The test predict Probability of each class:
 [[ 0.  0.  1.]
 [ 0.  1.  0.]
 [ 0.  1.  0.]
 [ 1.  0.  0.]
 [ 1.  0.  0.]
 [ 0.  0.  1.]
 [ 0.  0.  1.]
 [ 1.  0.  0.]
 [ 0.  1.  0.]
 [ 1.  0.  0.]
 [ 0.  1.  0.]
 [ 0.  1.  0.]
 [ 1.  0.  0.]
 [ 0.  1.  0.]
 [ 0.  1.  0.]
 [ 0.  1.  0.]
 [ 1.  0.  0.]
 [ 0.  1.  0.]
 [ 1.  0.  0.]
 [ 1.  0.  0.]
 [ 0.  0.  1.]
 [ 1.  0.  0.]
 [ 0.  0.  1.]
 [ 1.  0.  0.]
 [ 1.  0.  0.]
 [ 1.  0.  0.]
 [ 0.  1.  0.]
 [ 1.  0.  0.]
 [ 0.  1.  0.]
 [ 1.  0.  0.]
 [ 1.  0.  0.]
 [ 0.  0.  1.]
 [ 0.  0.  1.]
 [ 0.  1.  0.]
 [ 1.  0.  0.]
 [ 0.  1.  0.]
 [ 0.  1.  0.]
 [ 1.  0.  0.]
 [ 1.  0.  0.]
 [ 0.  1.  0.]
 [ 0.  0.  1.]
 [ 1.  0.  0.]
 [ 0.  1.  0.]
 [ 1.  0.  0.]
 [ 1.  0.  0.]
 [ 0.  0.  1.]
 [ 0.  0.  1.]
 [ 1.  0.  0.]
 [ 1.  0.  0.]
 [ 0.  1.  0.]
 [ 1.  0.  0.]
 [ 1.  0.  0.]
 [ 0.  1.  0.]
 [ 0.  1.  0.]
 [ 0.  0.  1.]
 [ 0.  0.  1.]
 [ 0.  1.  0.]
 [ 1.  0.  0.]
 [ 1.  0.  0.]
 [ 1.  0.  0.]
 [ 0.  1.  0.]
 [ 0.  1.  0.]
 [ 0.  0.  1.]
 [ 0.  0.  1.]
 [ 1.  0.  0.]
 [ 0.  1.  0.]
 [ 0.  0.  1.]
 [ 1.  0.  0.]
 [ 1.  0.  0.]]
The accuracy of the Logistic Regression is: 0.996363636364
The accuracy of the Logistic Regression is: 0.95652173913
"""/
# 查看混淆矩阵
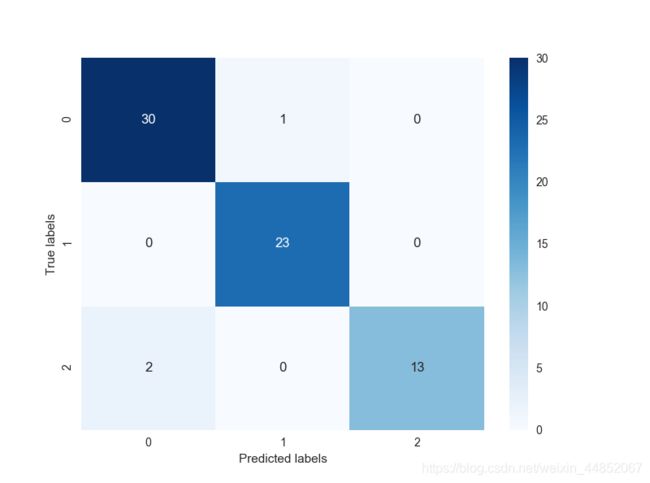
confusion_matrix_result = metrics.confusion_matrix(test_predict, y_test)
print('The confusion matrix result:\n', confusion_matrix_result)
# 利用热力图对于结果进行可视化
plt.figure(figsize=(8, 6))
sns.heatmap(confusion_matrix_result, annot=True, cmap='Blues')
plt.xlabel('Predicted labels')
plt.ylabel('True labels')
plt.show()


/"""
The confusion matrix result:
 [[30  1  0]
 [ 0 23  0]
 [ 2  0 13]]
"""/
accuracy of the Logistic Regression is: 0.95652173913
“”"/
```Python
# 查看混淆矩阵
confusion_matrix_result = metrics.confusion_matrix(test_predict, y_test)
print('The confusion matrix result:\n', confusion_matrix_result)
# 利用热力图对于结果进行可视化
plt.figure(figsize=(8, 6))
sns.heatmap(confusion_matrix_result, annot=True, cmap='Blues')
plt.xlabel('Predicted labels')
plt.ylabel('True labels')
plt.show()


/"""
The confusion matrix result:
 [[30  1  0]
 [ 0 23  0]
 [ 2  0 13]]
"""/
6.决策树小结
- 分类决策树模型表示基于特征对于实例进行分类的树形结构;决策树可以转换成if-then规则的集合,也可以看做是定义在特征空间划分上的类的条件概率分布。
- 决策树学习算法包括三部分:特征选择、决策树生成以及决策树剪枝。常用的算法有ID3、C4.5和CART。
- 特征选择目的在于选择对训练数据能够分类的特征,特征分类的关键在于其准则。常用的准则有信息增益(ID3)、信息增益比(C4.5)和基尼系数(CART)。
- 决策树的生成式从根结点开始,计算信息增益或者其他指标,选取局部最优特征,递归生成决策树。
- 决策树剪枝是为了防止决策树生成过程中产生的过拟合问题。


