数据挖掘算法之 k-means
k-均值聚类算法
算法描述:
1、为中心向量c1, c2, …, ck初始化k个种子
2、分组:
(1)将样本分配给距离其最近的中心向量
(2)由这些样本构造不相交( non-overlapping )的聚类
3、确定中心:
用各个聚类的中心向量作为新的中心
4、重复分组和确定中心的步骤,直至算法收敛。
原理:
K-Means算法的思想很简单,对于给定的样本集,按照样本之间的距离大小,将样本集划分为K个簇。让簇内的点尽量紧密的连在一起,而让簇间的距离尽量的大。
如果用数据表达式表示,假设簇划分为(C1,C2,...Ck),则我们的目标是最小化平方误差E:
E=∑i=1k∑x∈Ci||x−μi||22
其中μi是簇Ci的均值向量,有时也称为质心,表达式为:
μi=1|Ci|∑x∈Cix
如果我们想直接求上式的最小值并不容易,这是一个NP难的问题,因此只能采用启发式的迭代方法。
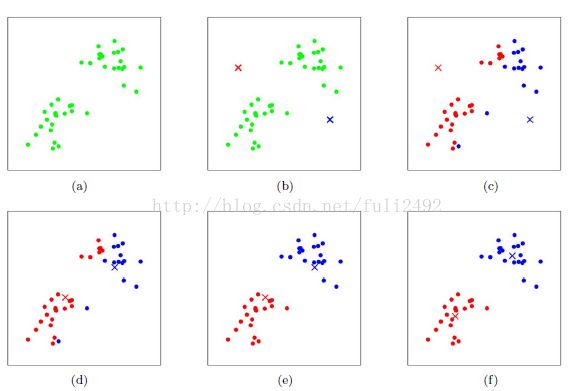
K-Means采用的启发式方式很简单,用下面一组图就可以形象的描述。
上图a表达了初始的数据集,假设k=2。在图b中,我们随机选择了两个k类所对应的类别质心,即图中的红色质心和蓝色质心,然后分别求样本中所有点到这两个质心的距离,并标记每个样本的类别为和该样本距离最小的质心的类别,如图c所示,经过计算样本和红色质心和蓝色质心的距离,我们得到了所有样本点的第一轮迭代后的类别。此时我们对我们当前标记为红色和蓝色的点分别求其新的质心,如图4所示,新的红色质心和蓝色质心的位置已经发生了变动。图e和图f重复了我们在图c和图d的过程,即将所有点的类别标记为距离最近的质心的类别并求新的质心。最终我们得到的两个类别如图f。
当然在实际K-Mean算法中,我们一般会多次运行图c和图d,才能达到最终的比较优的类别。
伪代码:
创建k个作为起始质心(通常是随机选择)
当任意一个点的簇分配结果发生改变时
对数据集中的每个数据点
对每个质心
计算质心与数据点之间的距离
将数据点分配到距离其最近的簇
对每一个簇,计算簇中所有点的均值并将均值作为质心
思路/思想:其基本思想是:通过迭代的方法,逐次更新各聚类中心的值,直至得到最好的聚类结果。
1、k-means算法的性能分析
主要优点:
是解决聚类问题的一种经典算法,简单、快速。
对处理大数据集,该算法是相对可伸缩和高效率的。因为它的复杂度是0 (n k t ) , 其中, n 是所有对象的数目, k 是簇的数目, t 是迭代的次数。通常k <
当结果簇是密集的,而簇与簇之间区别明显时, 它的效果较好。
主要缺点:
在簇的平均值被定义的情况下才能使用,这对于处理符号属性的数据不适用。
必须事先给出k(要生成的簇的数目),而且对初值敏感,对于不同的初始值,可能会导致不同结果。
它对于“躁声”和孤立点数据是敏感的,少量的该类数据能够对平均值产生极大的影响。
K-Means算法对于不同的初始值,可能会导致不同结果。解决方法:
1.多设置一些不同的初值,对比最后的运算结果)一直到结果趋于稳定结束,比较耗时和浪费资源
2.很多时候,事先并不知道给定的数据集应该分成多少个类别才最合适。这也是 K-means 算法的一个不足。有的算法是通过类的自动合并和分裂,得到较为合理的类型数目 K.
数据挖掘算法之 k-means实验:
java源代码和工具下载链接:https://pan.baidu.com/s/1bpg0GsZ 密码: pt6p
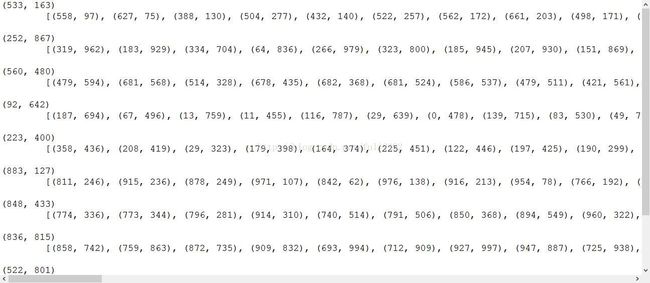
质心和数据集:
说明:本程序中的数据为随机生成,如果你需要,也可以使用文件输入。只需要修改如下位置的代码即可:
public class KmeansClient {
public static void main(String[] args) {
new KmeansClient().execute(10, 100);
}
private void execute(int k, int threshold) {
( ... 此处省略 N 行 ... )
List
List
( ... 此处省略 N 行 ... )
}
}
可视化
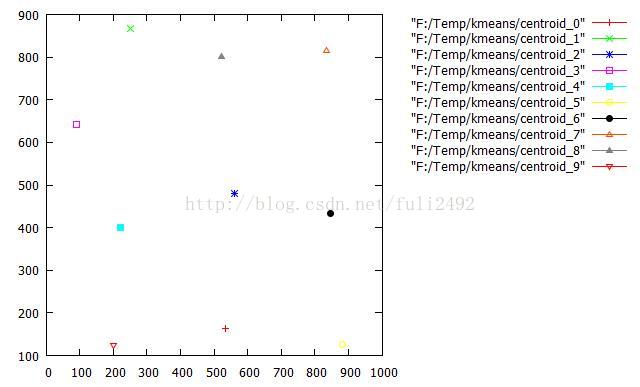
将上面的数据代入程序,可以获取如下可视化结果。只是这个结果并不是一个确定的结果,会因结束条件、始初质心的选取不同而异(本程序的初始质心选取为随机选取)。 此处使用的是 Gnuplot 可视化工具。执行可视化代码如下:
执行质心可视化代码如下:
plot "F:/Temp/kmeans/points_0" with linespoints pointtype 1 pointsize 1,\
"F:/Temp/kmeans/points_1" with linespoints pointtype 2 pointsize 1,\
"F:/Temp/kmeans/points_2" with linespoints pointtype 3 pointsize 1,\
"F:/Temp/kmeans/points_3" with linespoints pointtype 4 pointsize 1,\
"F:/Temp/kmeans/points_4" with linespoints pointtype 5 pointsize 1,\
"F:/Temp/kmeans/points_5" with linespoints pointtype 6 pointsize 1,\
"F:/Temp/kmeans/points_6" with linespoints pointtype 7 pointsize 1,\
"F:/Temp/kmeans/points_7" with linespoints pointtype 8 pointsize 1,\
"F:/Temp/kmeans/points_8" with linespoints pointtype 9 pointsize 1,\
"F:/Temp/kmeans/points_9" with linespoints pointtype 10 pointsize 1
执行数据集可视化代码如下:
plot "F:/Temp/kmeans/centroid_0" with linespoints pointtype 1 pointsize 1,\
"F:/Temp/kmeans/centroid_1" with linespoints pointtype 2 pointsize 1,\
"F:/Temp/kmeans/centroid_2" with linespoints pointtype 3 pointsize 1,\
"F:/Temp/kmeans/centroid_3" with linespoints pointtype 4 pointsize 1,\
"F:/Temp/kmeans/centroid_4" with linespoints pointtype 5 pointsize 1,\
"F:/Temp/kmeans/centroid_5" with linespoints pointtype 6 pointsize 1,\
"F:/Temp/kmeans/centroid_6" with linespoints pointtype 7 pointsize 1,\
"F:/Temp/kmeans/centroid_7" with linespoints pointtype 8 pointsize 1,\
"F:/Temp/kmeans/centroid_8" with linespoints pointtype 9 pointsize 1,\
"F:/Temp/kmeans/centroid_9" with linespoints pointtype 10 pointsize 1
可能遇到的问题:
1.源代码下载后,缺少文件/类?
不存在的,我已经调试并成功运行了,只需点击下载上文中提到的的云盘链接。
你可以在https://github.com/William-Hai/JCore-UtilLibrary中找到缺少的类。
2.Gnuplot不会用?
你可以参考http://dl.pconline.com.cn/download/1038024.html
你可能需要用的命令:
图例显示在外部:set key outside
设置x轴范围:set xrange [0 : 1000]
设置y轴范围:set yrange [0 : 1000]
此处使用的是 Gnuplot 可视化工具。执行可视化代码如下:(设置连线,点的类型的大小)
plot "F:/Temp/kmeans/centroid_0" with linespoints pointtype 1 pointsize 1,\
"F:/Temp/kmeans/centroid_1" with linespoints pointtype 2 pointsize 1,\
"F:/Temp/kmeans/centroid_2" with linespoints pointtype 3 pointsize 1,\
"F:/Temp/kmeans/centroid_3" with linespoints pointtype 4 pointsize 1,\
"F:/Temp/kmeans/centroid_4" with linespoints pointtype 5 pointsize 1,\
"F:/Temp/kmeans/centroid_5" with linespoints pointtype 6 pointsize 1,\
"F:/Temp/kmeans/centroid_6" with linespoints pointtype 7 pointsize 1,\
"F:/Temp/kmeans/centroid_7" with linespoints pointtype 8 pointsize 1,\
"F:/Temp/kmeans/centroid_8" with linespoints pointtype 9 pointsize 1,\
"F:/Temp/kmeans/centroid_9" with linespoints pointtype 10 pointsize 1
plot "F:/Temp/kmeans/points_0" with linespoints pointtype 1 pointsize 1,\
"F:/Temp/kmeans/points_1" with linespoints pointtype 2 pointsize 1,\
"F:/Temp/kmeans/points_2" with linespoints pointtype 3 pointsize 1,\
"F:/Temp/kmeans/points_3" with linespoints pointtype 4 pointsize 1,\
"F:/Temp/kmeans/points_4" with linespoints pointtype 5 pointsize 1,\
"F:/Temp/kmeans/points_5" with linespoints pointtype 6 pointsize 1,\
"F:/Temp/kmeans/points_6" with linespoints pointtype 7 pointsize 1,\
"F:/Temp/kmeans/points_7" with linespoints pointtype 8 pointsize 1,\
"F:/Temp/kmeans/points_8" with linespoints pointtype 9 pointsize 1,\
"F:/Temp/kmeans/points_9" with linespoints pointtype 10 pointsize 1
3.没有输出结果?
你可能需要在F盘下新建Temp文件夹,在Temp下新建kmeans文件夹因为源代码的输出目录为F:/Temp/kmeans/
4.找不到Gnuplot 可视化工具的应用程序入口?
你可以参考http://dl.pconline.com.cn/download/1038024.html
转载:
https://github.com/MachineLeanring/MachineLearningKmeans
http://blog.csdn.net/lemon_tree12138
参考:http://blog.csdn.net/cyxlzzs/article/details/7416491
数据挖掘十大算法--K-均值聚类算法
https://wizardforcel.gitbooks.io/dm-algo-top10/content/k-means.html
数据挖掘—— k-means 聚类算法
https://github.com/ZLsuyan/KMeans
网易视频讲解:
http://open.163.com/movie/2008/1/O/T/M6SGF6VB4_M6SGKGMOT.html
聚类、K-Means、例子、细节:
http://www.jianshu.com/p/fc91fed8c77b
机器学习知识库:
http://archive.ics.uci.edu/ml/index.php
其他出自百度搜索


